


A new report on China’s births, ageing, and internal migration finds that even a substantial recovery in fertility would do little to slow ageing before 2050.
One constraint is the country’s skewed sex ratio: among those born between 2006 and 2010, there were more than 120 boys for every 100 girls. As these cohorts enter their prime marriage and childbearing years, the imbalance is likely to further depress marriages and births. At the same time, women have come to make up a growing share of the highly educated population, reaching about 53 per cent in 2020, creating partner shortages at both ends of the educational spectrum.
Meanwhile, China’s migrant workforce is ageing, the rural labour pool that powered decades of industrialisation is nearing exhaustion, and population growth is becoming concentrated in a smaller number of productive metropolitan regions. This risks leaving transport infrastructure underused as ageing widens social-security finances.
The report is authored by Li Xunlei, Chief Economist at Zhongtai Financial International Limited; Tang Jun, an FOF fund manager at Zhongtai Asset Management; and Li Qianyun, head of Zhongtai’s fund research team. It was posted on 12 July 2026 on 李迅雷金融与投资 Finance & Investment with Li Xunlei, Li’s personal WeChat blog.
Li has kindly authorised and reviewed the translation.
—Yuxuan Jia



中国人口往何处去?(2026年版)
Where Is China’s Population Headed? (2026 Edition)
Abstract
China’s population will age rapidly between now and 2050, and this trajectory is largely unavoidable. Even a substantial rebound in fertility would do little to slow the acceleration of population aging. By 2031, people aged 65 and over are projected to account for 20 percent of the population, placing China among the world’s super-aged societies. By around 2050, that share is expected to reach 29 percent — roughly the current level in Japan, the world’s most aged society.
Gender imbalance may become an important constraint on any recovery in fertility. Among children born between 2006 and 2015, the male-to-female ratio remained above 115:100. Within five years, this imbalance will likely have a significant and lasting impact on birth rates. At the same time, women have come to make up a growing share of the highly educated population, reaching about 53 per cent in 2020, even though women account for less than half of the population overall. This implies an even sharper gender imbalance among people with lower levels of education.
Policies designed to encourage childbirth are likely to raise the number of births to some extent, but they will have little effect on the pace of population ageing in the near term. China still has a very large population and has already entered a period of accelerating ageing. Even if fertility rises, any meaningful reduction in the old-age share or the dependency ratio is unlikely to become visible until after 2050.
The decline in China’s total population is already clear. Under the baseline scenario, the population is projected to fall below 1.3 billion in 2037, below 1.2 billion around 2046, and below 1 billion around 2060. By 2100, it may fall below 500 million. The dependency ratio is projected to reach 47 per cent by 2035 and 62 per cent by 2050.
In 2025, China’s migrant workers had an average age of 43.3, and 32 per cent were aged 50 or above. The number who age out of migrant work and return to their home areas will continue to rise. The rural labour pool available for migration to cities is therefore nearing exhaustion. Future population growth in large cities will increasingly come from redistribution within the urban system and from the continued concentration of people in major metropolitan areas. Excluding natural population growth, net population inflows are increasingly concentrated in Guangdong, Zhejiang, and Jiangsu.
Among 337 Chinese cities classified as fifth-tier or above, 185 recorded a decline in their resident population between 2024 and 2025 — more than half of the total. (Because city-level data remain incomplete, these figures have not been adjusted for natural population change.) A further 65 cities had not yet released resident-population data for 2025.
A vibrant private sector and digital economy have made some regions especially attractive to migrants. Zhejiang is one of China’s most economically dynamic provinces and has recorded the fastest growth in net population inflows. Excluding natural population change, its resident population increased through net migration by 7.6 per cent over the past eight years, far faster than in any other province. The Yangtze River Delta is already relatively aged, so its population growth depends heavily on inward migration. In 2025, after adjusting for natural population decline, Zhejiang and Jiangsu recorded net interprovincial inflows of 389,000 and 227,000 people, respectively.
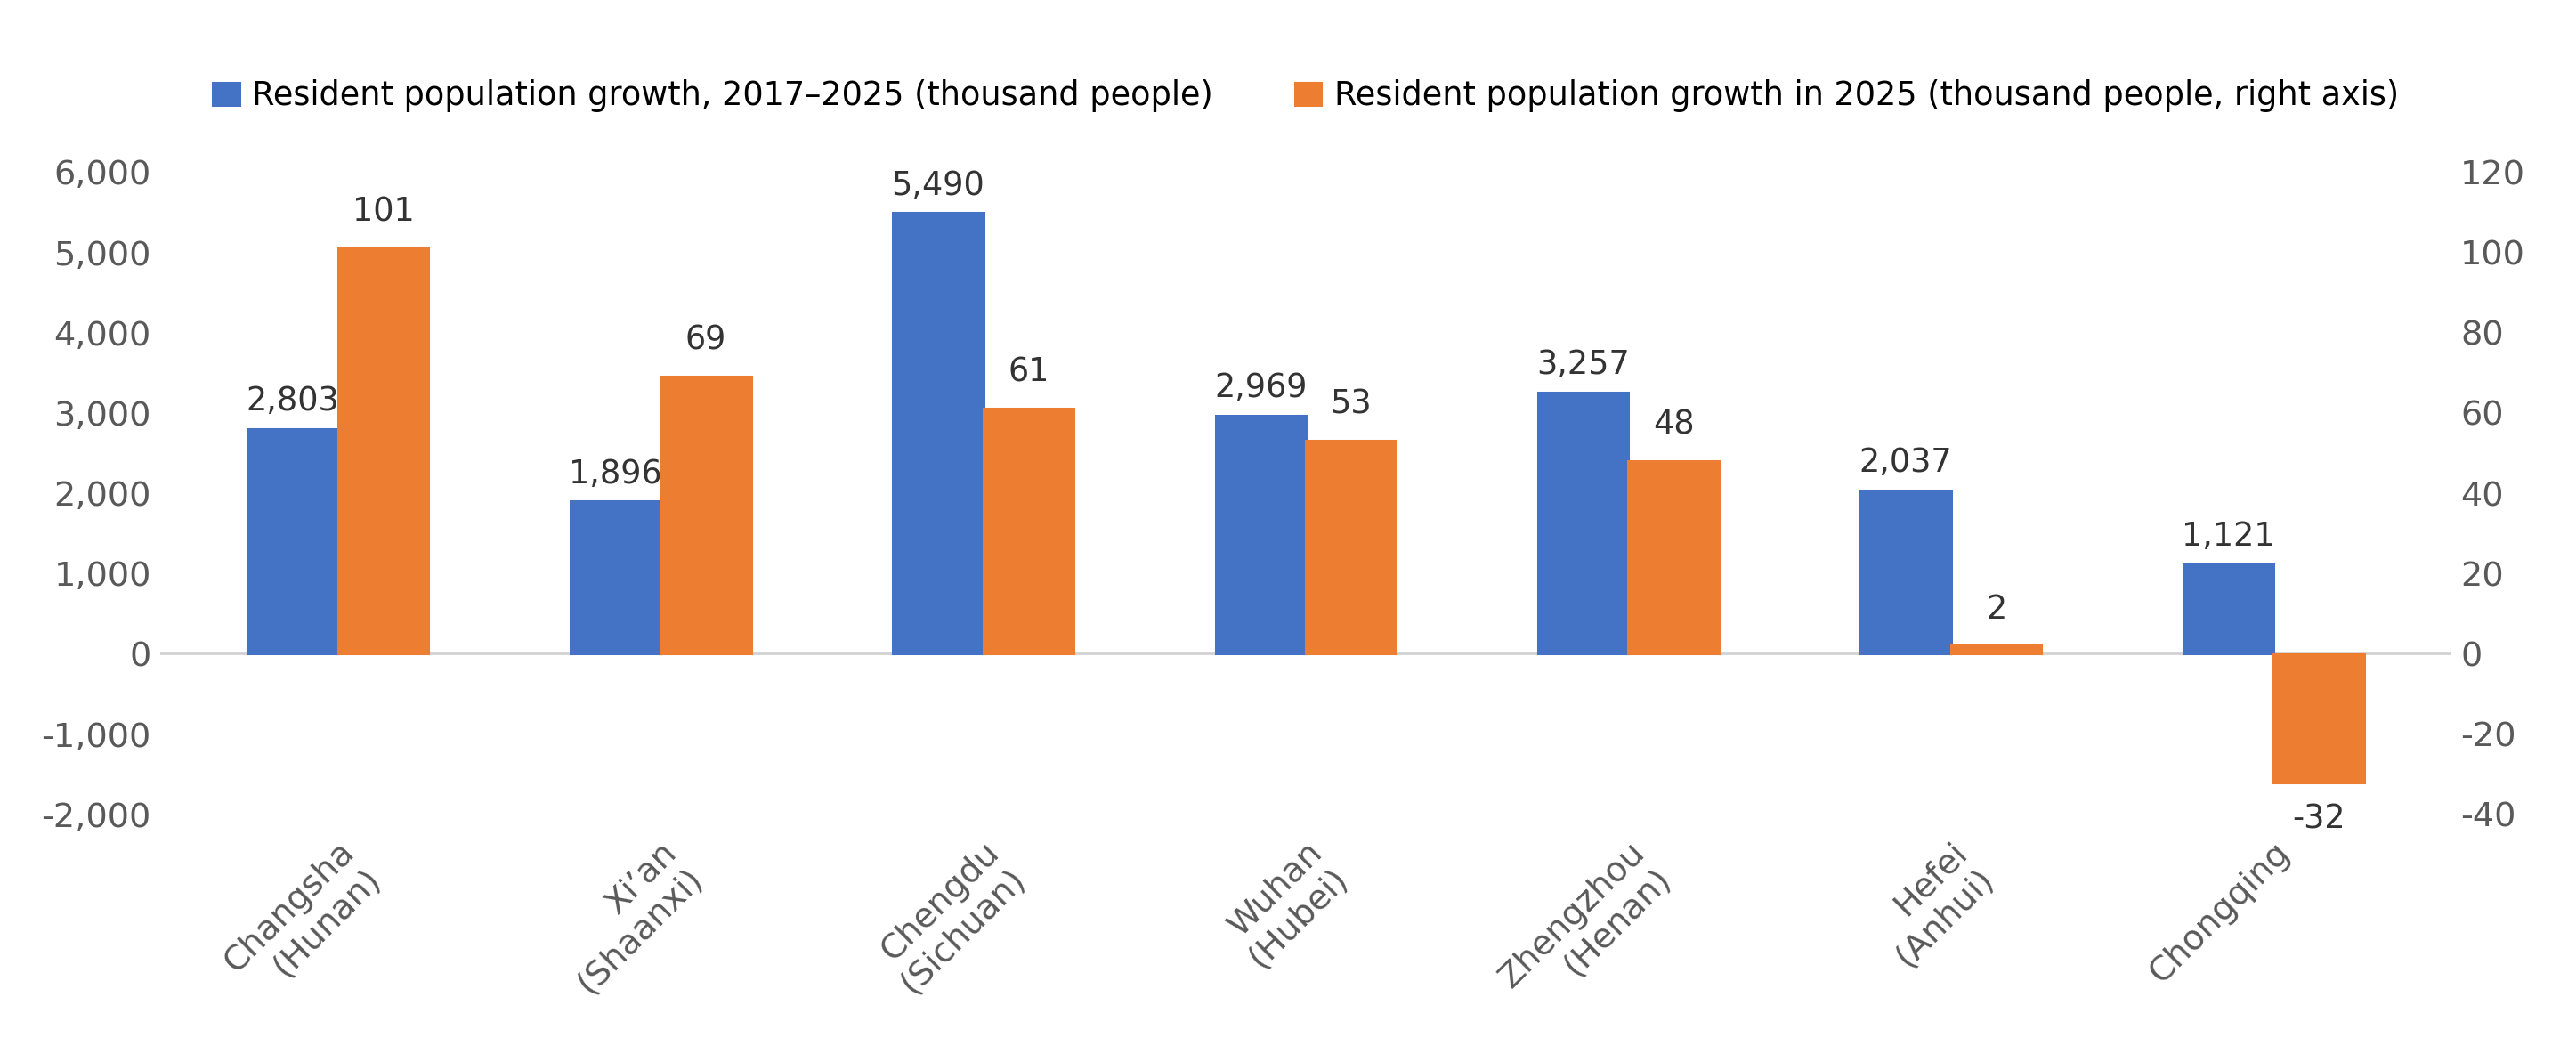
Major provincial capitals and metropolitan centres continue to draw population from surrounding areas. Between 2017 and 2025, the resident populations of Chengdu–Chongqing, Wuhan, Zhengzhou, Changsha, Xi’an, and Hefei each grew by more than one million. Chengdu led the group, adding 5.49 million residents. Yet every province containing these cities recorded an overall decline in resident population over the same eight-year period.
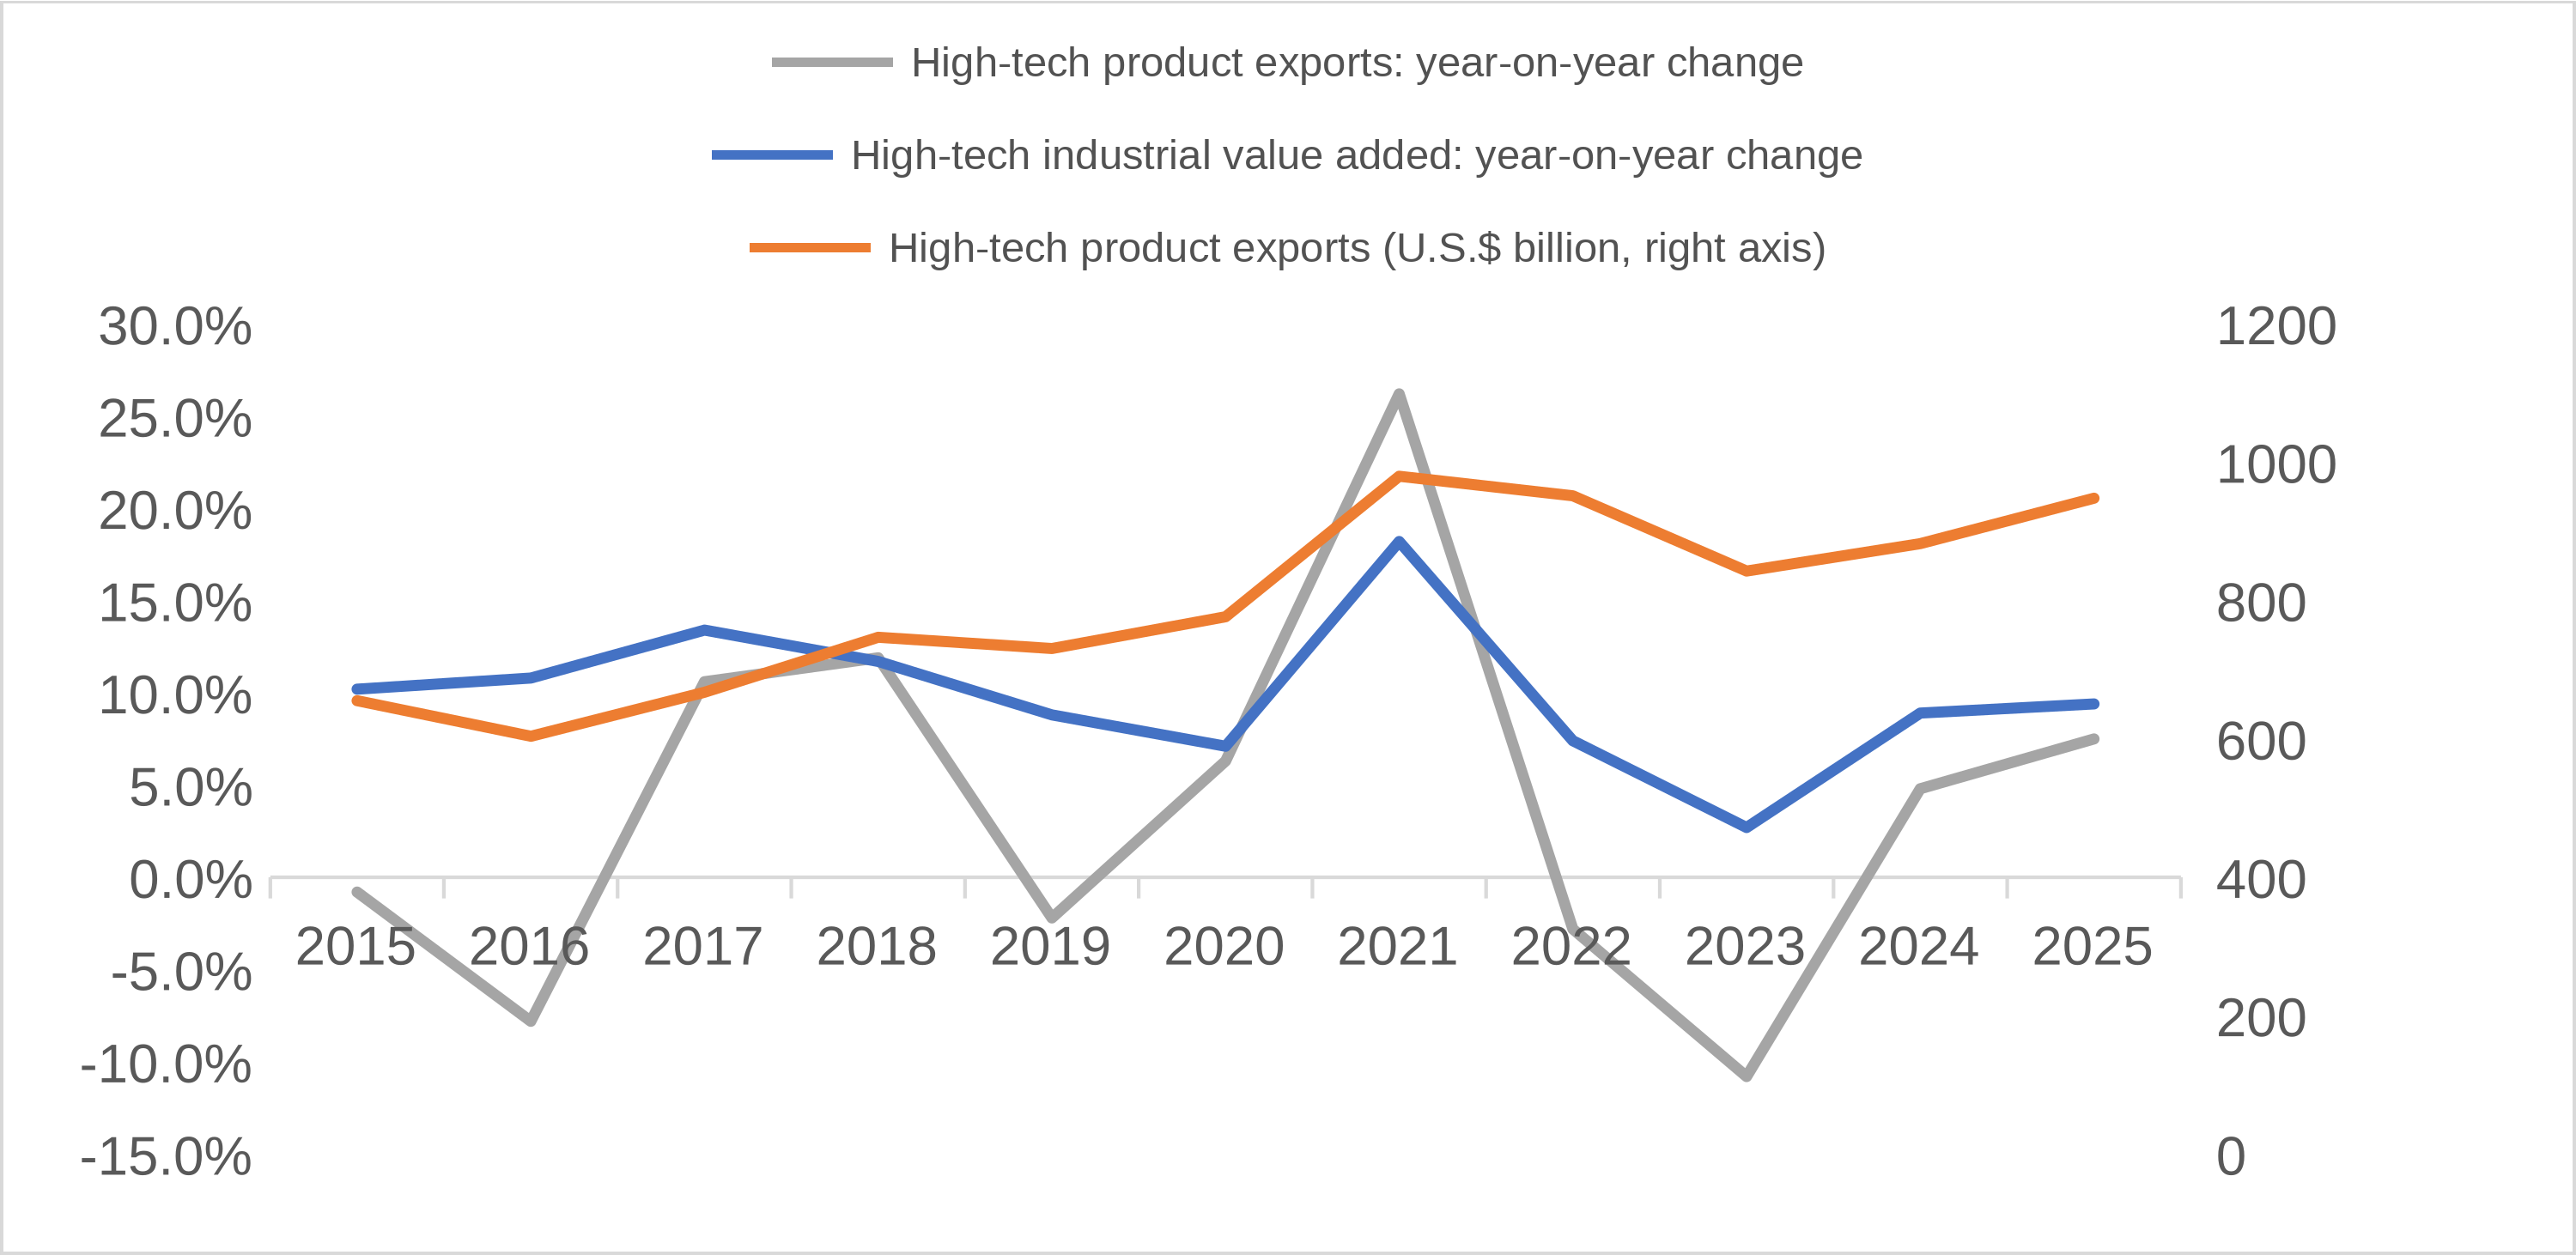
China’s high-tech industries are still expanding rapidly in both scale and revenue. The growth of high-value-added industries and the wage premium they offer draw young people and skilled workers across regional boundaries. Supporting service workers then follow, creating a complete ecosystem of population concentration. Zhejiang, Shanghai, and Jiangsu offer large numbers of jobs in advanced manufacturing, the digital economy, and services, making them the main drivers of population concentration in the Yangtze River Delta.
This is the third report in our series on births, population ageing, and internal migration in China. The first two reports were based on national and provincial demographic data released in 2022 and 2024. In recent years, however, local governments have disclosed less demographic information, making analysis and forecasting increasingly difficult. Comparing our earlier projections with subsequent outcomes, we found that we had overestimated births and underestimated the pace at which life expectancy was improving. We have therefore revised the model used in this report. Since China’s total population began to decline in 2022, we have continued to track changes in the age structure and sex composition of the population, patterns of regional migration, and the relationship between migration and industrial development.
Why Were Births in 2025 Lower Than Expected?
In Where Is China’s Population Headed? (2023 Edition), we projected China’s demographic and ageing trends on the basis of two main assumptions.
First, we used fertility data from 2018 and 2019 to estimate the underlying willingness to have children. Births in 2016 and 2017 had been temporarily elevated after the relaxation of birth restrictions released pent-up demand for second children, while pandemic controls between 2020 and 2022 may have caused some couples to postpone childbearing.
Second, we assumed that the willingness to have children would continue to decline, drawing on the experience of Japan, South Korea, and other countries. International evidence suggests that fertility generally falls as the urbanisation rate and per capita income rise. Combining these assumptions with the number and age distribution of women of childbearing age, we projected China’s future population and the pace of population ageing.
When data for 2024 became available, it became clear that our original assumptions had been too optimistic. In Where Is China’s Population Headed? (2025 Concise Edition), we therefore lowered the starting fertility-rate assumption while retaining the assumption that fertility would continue to decline. That report reached three main conclusions:
Annual births were projected to fall below 9 million in 2025, below 8 million in 2028, and possibly below 7 million by 2035, with the pace of decline easing over the following decade.
China’s total population could fall below 1.4 billion in 2027, below 1.3 billion in 2039, and below 1.2 billion in 2047.
Population ageing would accelerate. China was projected to become a super-aged society around 2032 and to reach Japan’s current level of ageing by 2048.
According to the National Bureau of Statistics, China recorded 7.92 million births in 2025, well below our model’s estimate of about 8.9 million. From 2022 to 2025, the model overestimated births while projecting a total population lower than the figure eventually reported. This indicates that the assumed mortality rates for older age groups were also too high. Put differently, life expectancy improved faster than the model had anticipated.
The economic consequences of China’s demographic shift may therefore be more severe than expected. Births falling below 8 million this early suggest that many people are not optimistic about their own or their families’ future prospects. Meanwhile, the fact that the total population declined more slowly than projected indicates that older people are living longer. This will accelerate population ageing and place additional pressure on public finances.
Further Refinement of the Population Projection Model
Core Assumptions: Age-Specific Fertility and Mortality Rates
Earlier versions of the model focused mainly on assumptions about the initial level of fertility and the speed at which it would decline. Age-specific mortality rates were largely projected by extending historical patterns. Recent results, however, show that changes in mortality at older ages—and thus in life expectancy—have a substantial effect on projections of both China’s total population and the share of older people. These assumptions therefore require more careful treatment.
Figure 1 provides a schematic overview of the model. It rests on two main sets of assumptions: age-specific fertility rates, including both their current levels and future paths; and age-specific mortality rates. Once these assumptions are established, the size of each age group can be projected forward over time.
For example, the number of births can be calculated by combining the age distribution of women of childbearing age with the fertility rate for each age group. Five years later, those births determine the approximate size of the population aged 0–4. Applying the assumed mortality rate then allows the model to estimate how many of that cohort will be aged 5–9 five years later, and the same process can be repeated for each successive age group. Projected sex ratios determine the future number of women of childbearing age, which in turn feeds into the next projection of births. The model thus forms a closed, internally consistent system that can be extended forward through time.
Figure 1. Schematic Framework of the Population and Age-Structure Projection Model
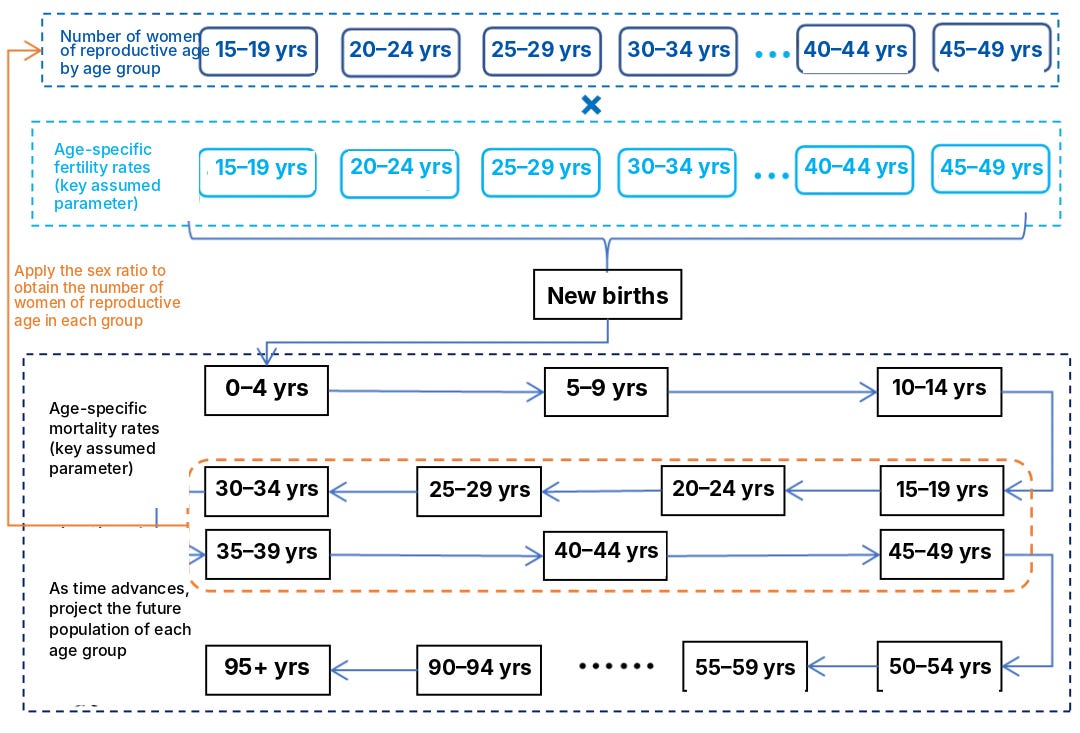
Using age-specific fertility rates and projecting how they will change is more appropriate than setting a single total fertility rate directly. China’s historical baby booms and decades of birth-control policies have produced a highly uneven age distribution among women of childbearing age. The number of women aged 35–49, for example, is substantially larger than the number aged 15–29. This can distort the total fertility rate and make it unusually volatile. Using it directly as an input may therefore generate larger forecasting errors.
Assumptions about fertility at different ages must also be demographically plausible. Fertility among women aged 15–24 may continue to decline, while fertility among those aged 30–49 may increase in relative terms. At the same time, the total fertility rate implied by these age-specific patterns must remain consistent with each scenario’s broader assumptions—continuing to fall in the pessimistic scenario, for instance, or gradually recovering in the optimistic scenario.
Assumptions about age-specific mortality are, in effect, assumptions about life expectancy. Life expectancy is calculated from mortality rates at each age. Unlike the average age at death, it measures how long a newborn would be expected to live if current age-specific mortality rates remained unchanged throughout that person’s life, and it is not affected by the population’s age structure. The average age at death, by contrast, is simply the average age of all those who die in a given year. It is easier to calculate but heavily influenced by demographic composition. As the baby-boomers move into old age, for example, a larger share of annual deaths will naturally occur at older ages, pushing up the average age at death.
Scenario Analysis of Population Ageing in China
To examine how the share of older people may evolve under different paths for fertility and life expectancy, this report considers three scenarios.
Pessimistic scenario: The total fertility rate continues to decline at its current pace, while life expectancy rises by about 0.2 years per year throughout the projection period.
Baseline scenario: The total fertility rate remains at roughly its current low level of 1.05 and no longer declines. Once life expectancy exceeds 80 years, its annual increase slows to about 0.1 years.
Optimistic scenario: With stronger policy support for childbearing, the total fertility rate gradually rises above 1.3, after which the pace of increase slows. Once life expectancy reaches 85 years, annual gains ease further to about 0.05 years.
The model produces the projections shown in Figure 2. Five conclusions follow.
Rapid population ageing before 2050 is unavoidable. Even in the optimistic scenario, a substantial rise in fertility has little effect on the share of people aged 65 and over before 2050. China’s current age structure has already determined the pace of ageing over the next two to three decades.
Under the baseline and pessimistic scenarios, the old-age share and dependency ratio eventually reach exceptionally high levels. By 2100, people aged 65 and over are projected to account for 41 per cent of the population in the baseline scenario and 50 per cent in the pessimistic scenario. The corresponding dependency ratios—the combined population of children and older people relative to the working-age population aged 15–64—reach 90 per cent and 120 per cent, respectively.
A substantial rise in fertility would significantly reduce ageing and dependency pressures after 2050. Under the optimistic scenario, both the old-age share and the dependency ratio will be markedly lower in 2100.
Higher fertility raises the dependency ratio in the short term. The projected dependency ratio in 2050 is actually higher in the optimistic scenario than in the other two scenarios because more births initially increase the number of dependent children before they enter the workforce.
A steep decline in the total population is unavoidable. China’s population falls substantially in all three scenarios, largely because of the country’s existing age structure.
Figure 2. Scenario Analysis of Population Ageing in China
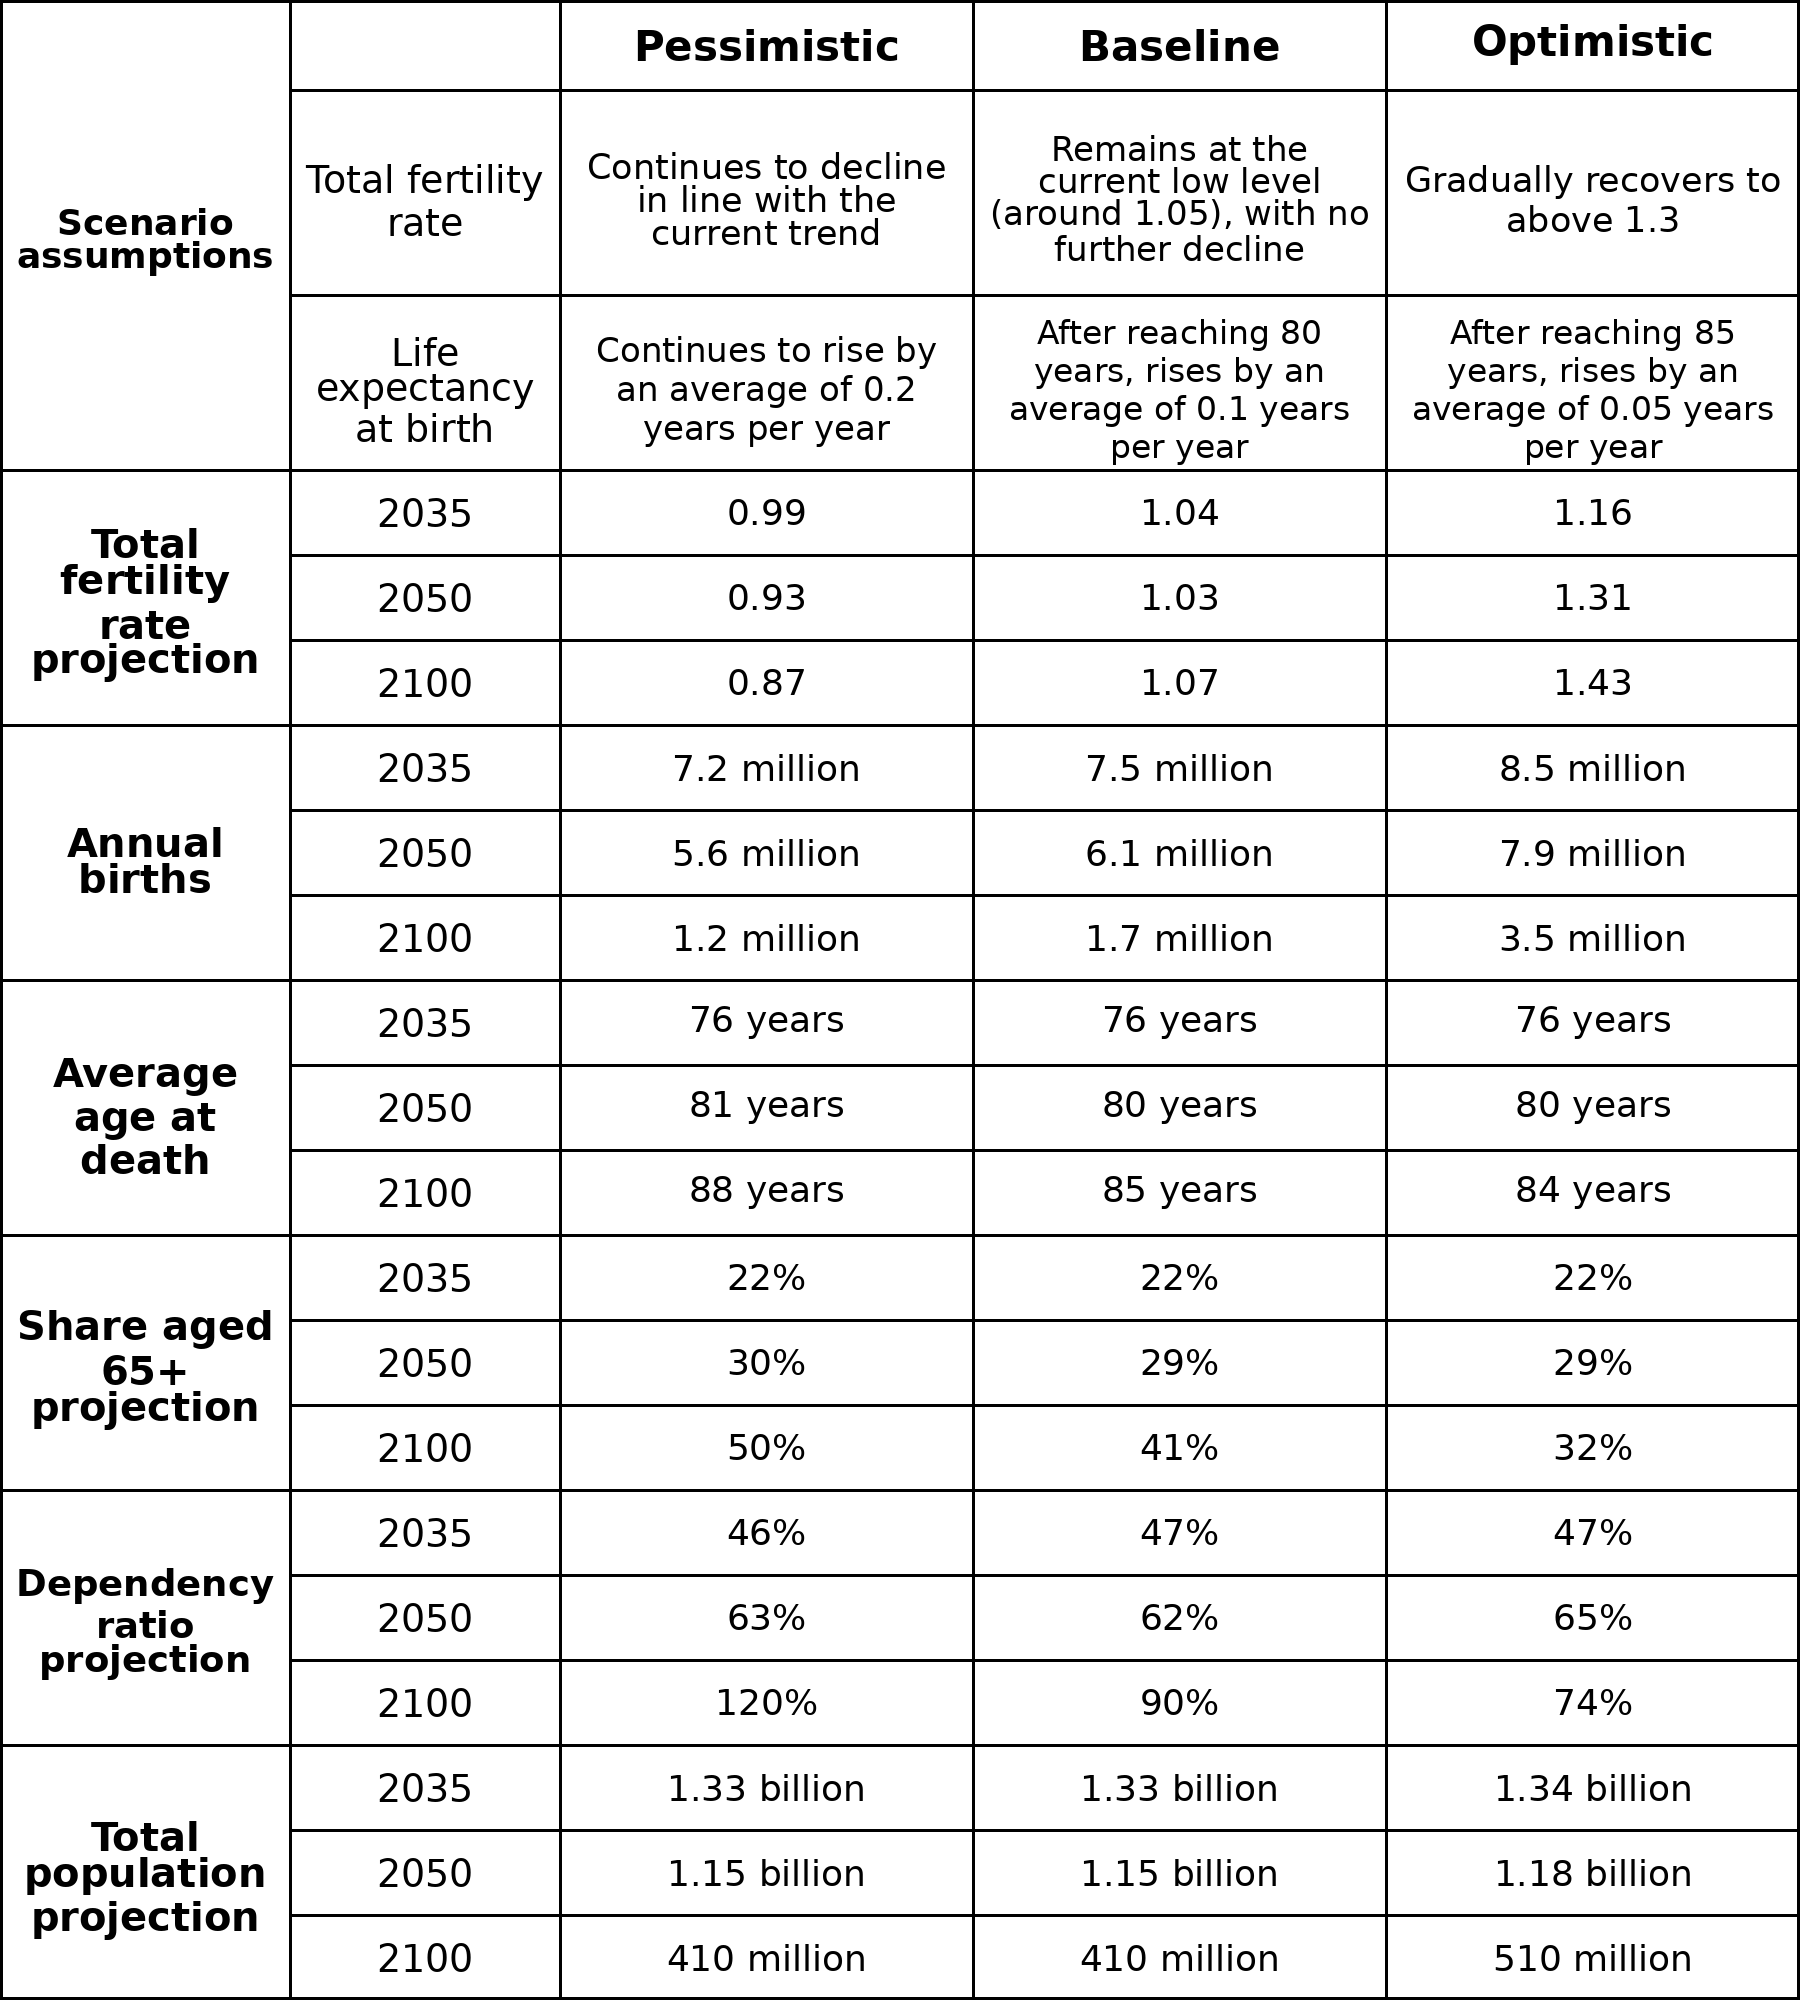
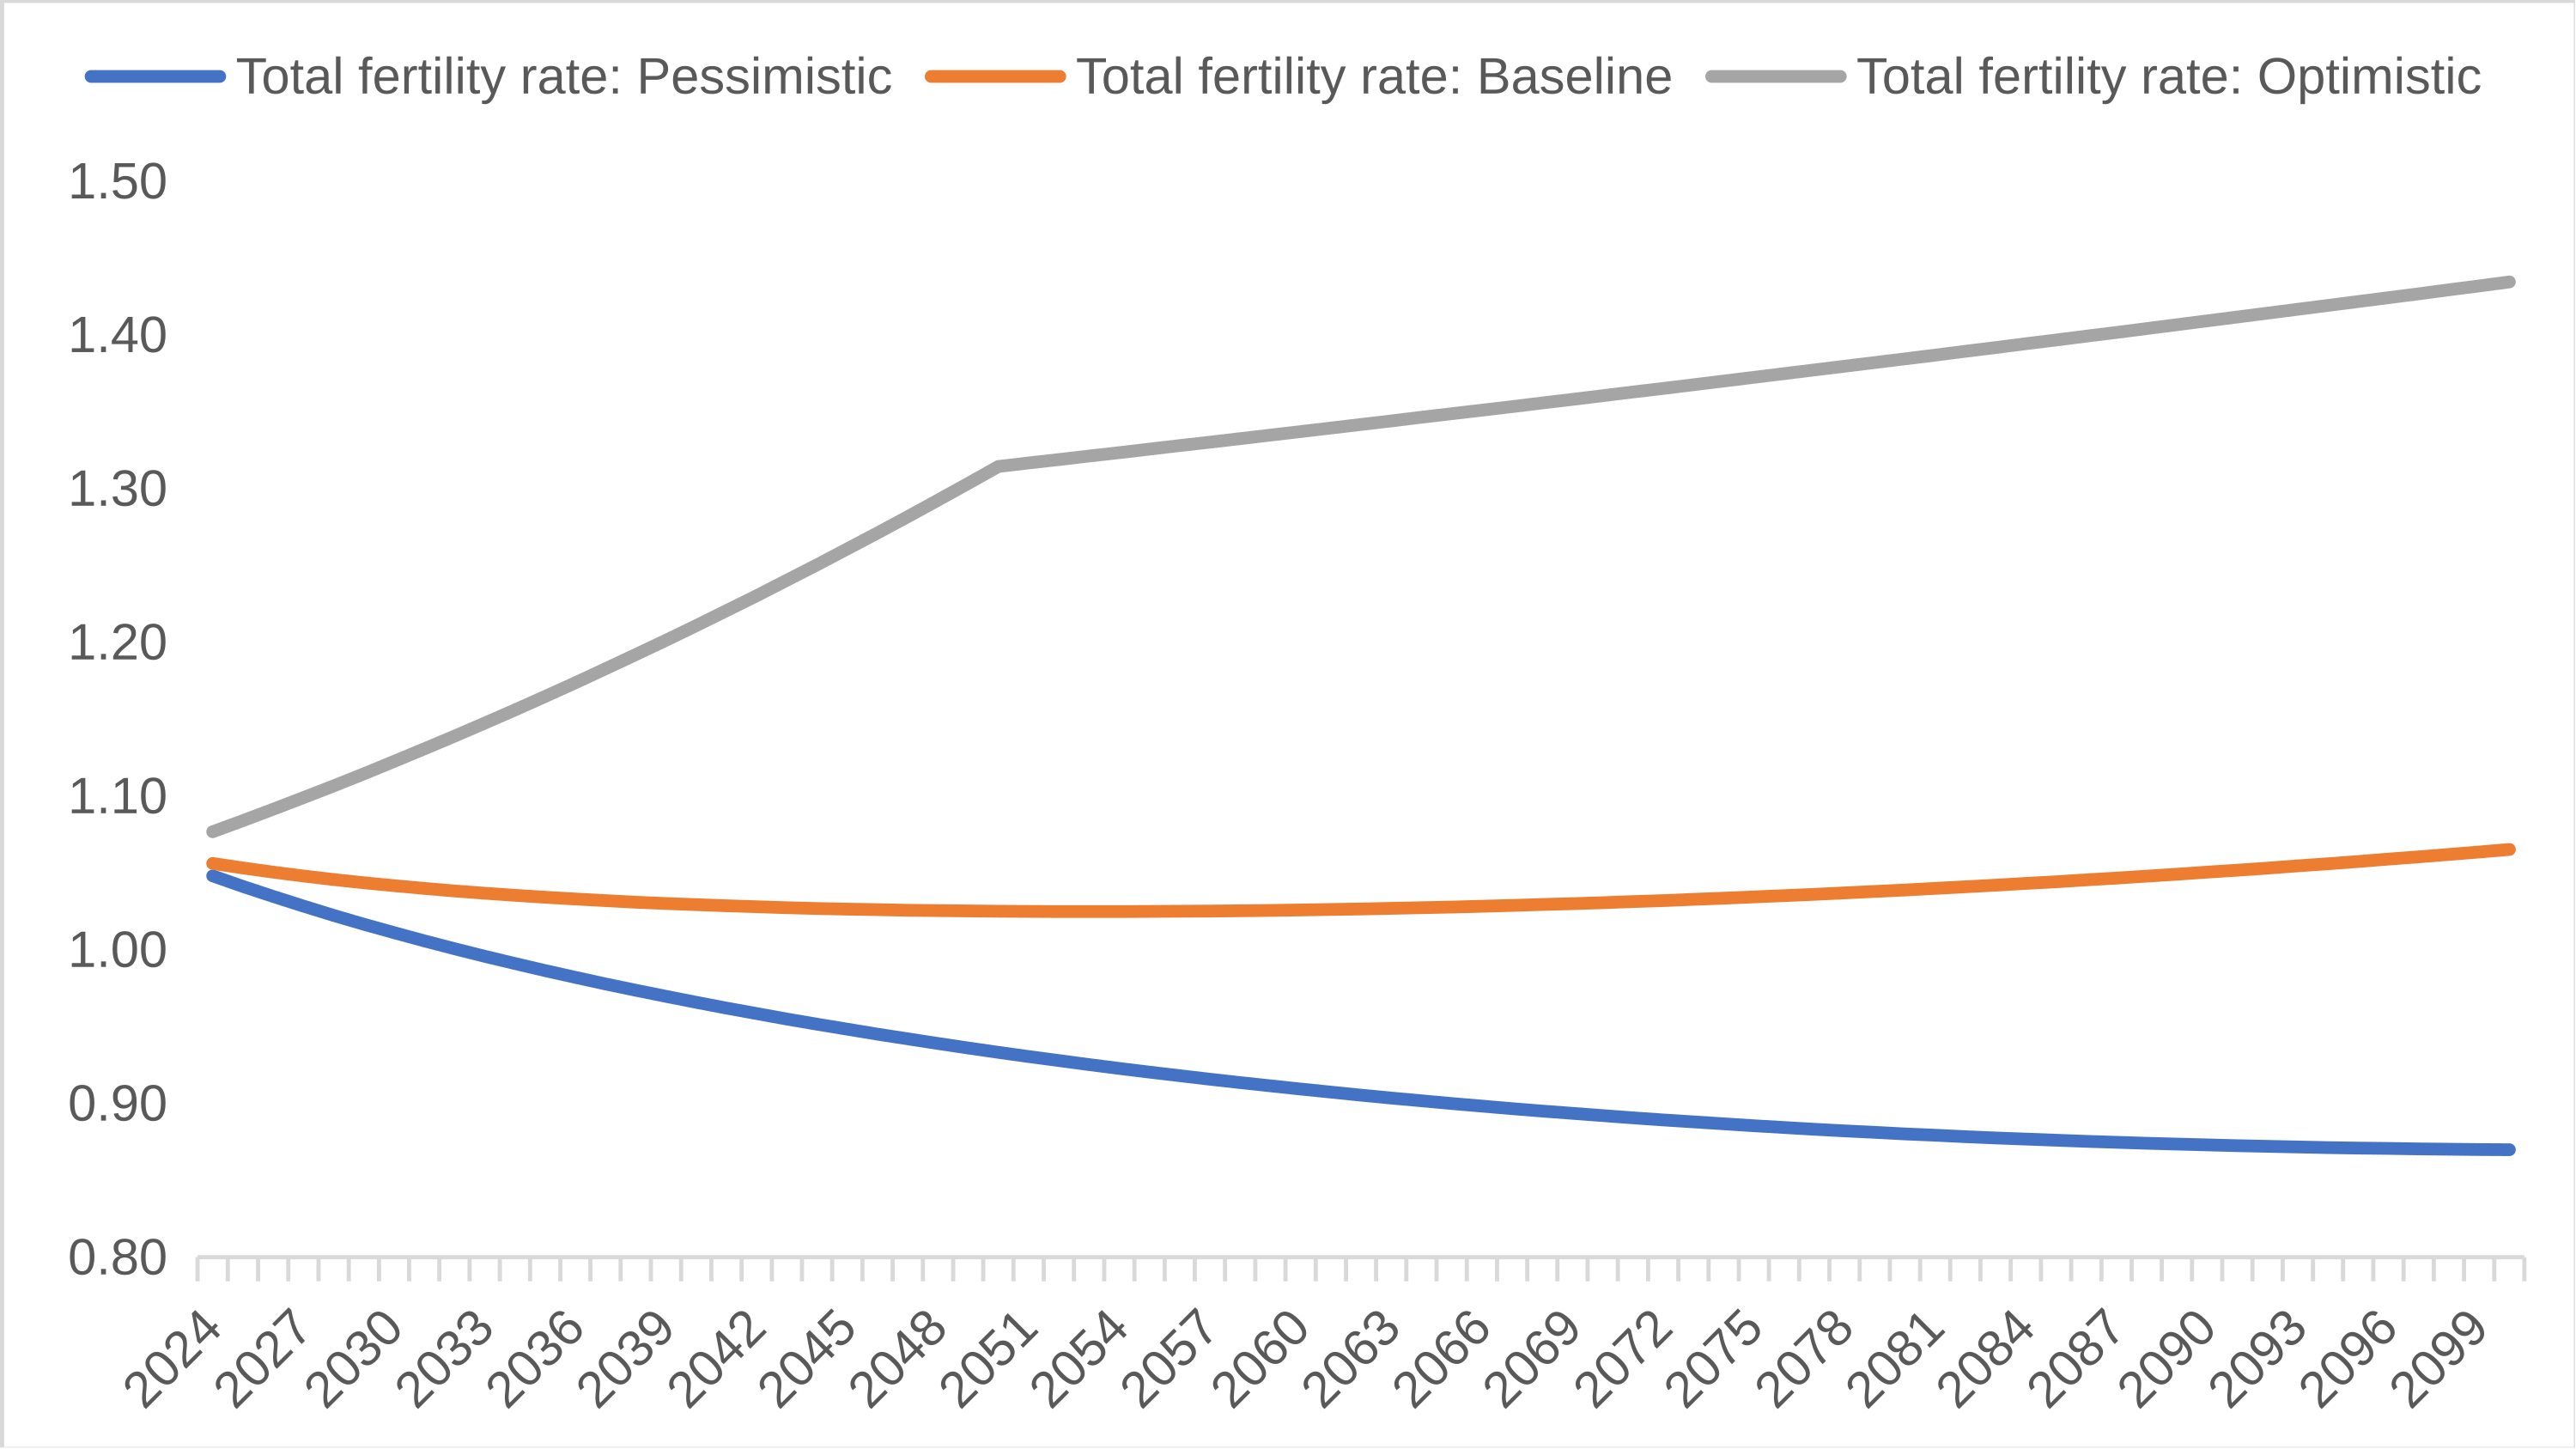
More specifically, under the pessimistic scenario, the total fertility rate is projected to continue along its current downward trajectory, falling to 0.93 by 2050 and 0.87 by 2100. For comparison, South Korea—the country with the world’s lowest fertility rate—recorded a total fertility rate of 0.80 in 2025.
Figure 3. Projected Total Fertility Rate Under the Three Scenarios
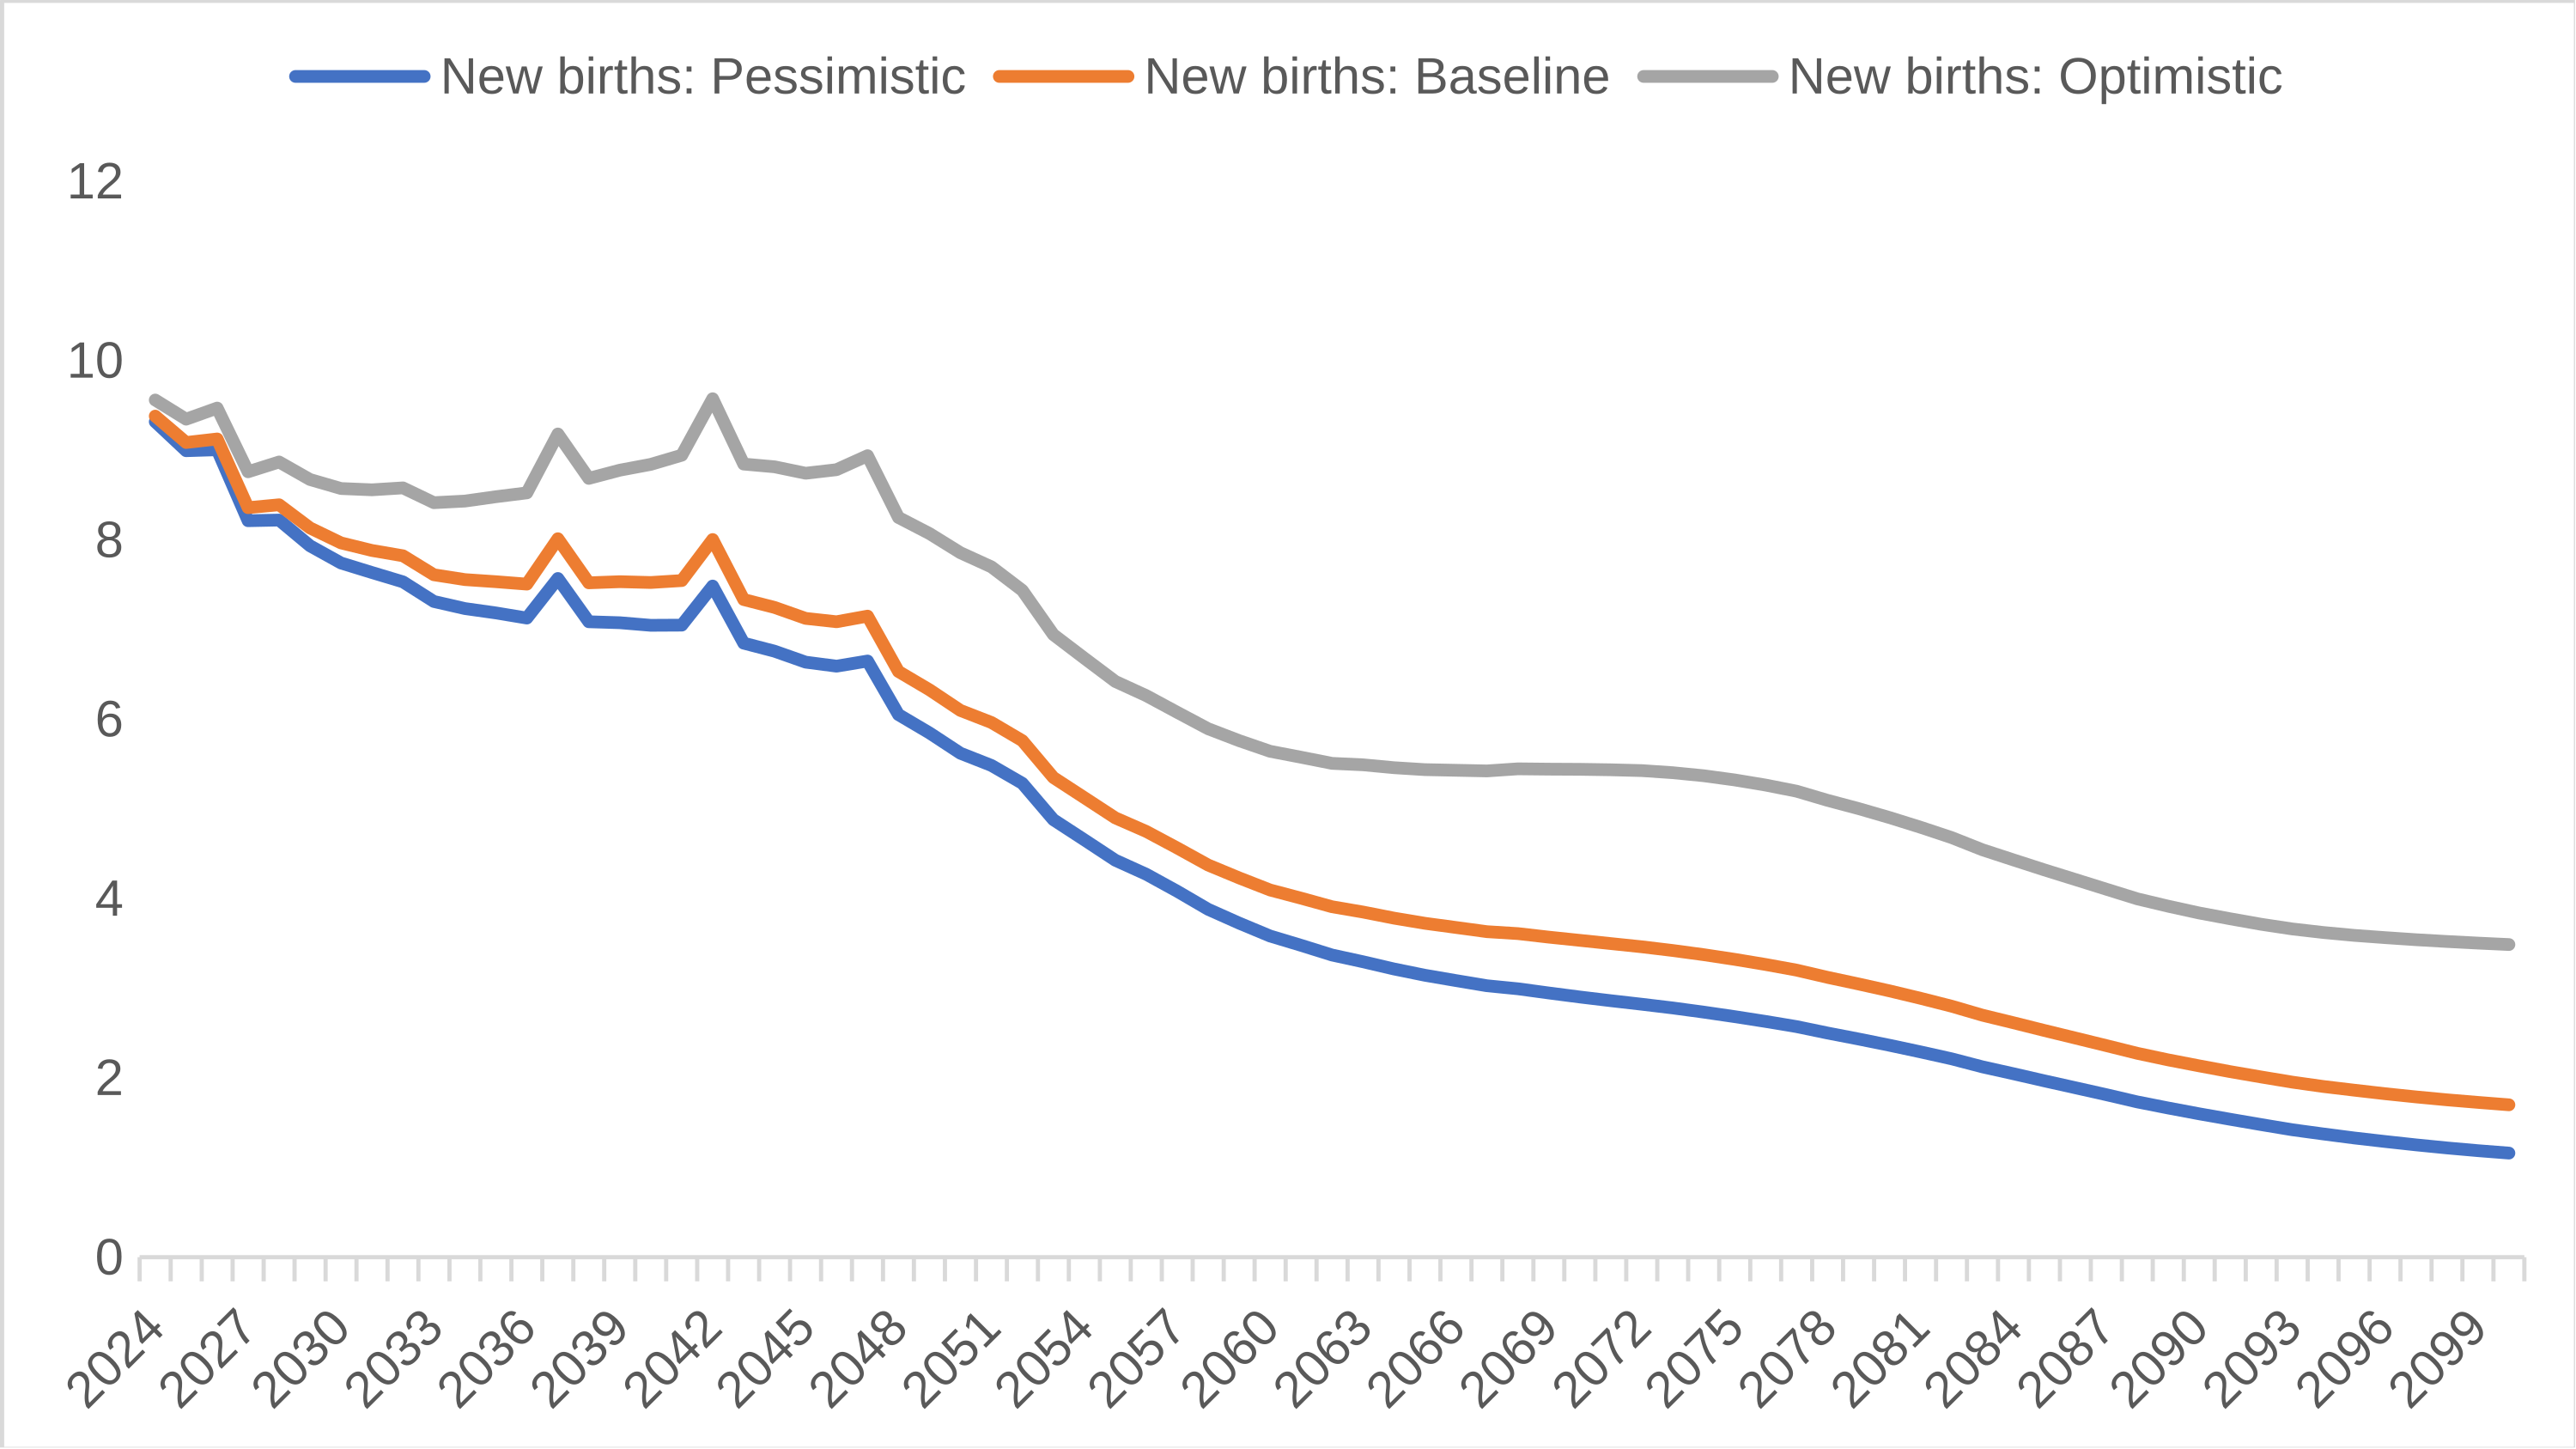
Unless fertility rises substantially, annual births will fall to between 5 million and 6 million by 2050 under both the pessimistic and baseline scenarios, and to fewer than 2 million by 2100. Under the optimistic scenario, in which the total fertility rate recovers to above 1.3, annual births stand at about 7.9 million in 2050 before declining to roughly 3.5 million by 2100. Even in this more favourable scenario, the long-term fall in births remains pronounced.
Figure 4. Projected Annual Births Under the Three Scenarios
All three scenarios show a similarly rapid rise in population ageing before 2050, with only modest differences among them. Around 2030, people aged 65 and over are projected to account for 20 per cent of the population, the threshold the UN used for a super-aged society. By around 2050, the share reaches 29 per cent—approximately Japan’s current level. The three paths diverge thereafter. Under the pessimistic scenario, the old-age share continues to rise until it reaches about 50 per cent by the end of the century. Under the optimistic scenario, it peaks at around 37 per cent before falling gradually to 32 per cent in 2100.
Figure 5. Projected Share of the Population Aged 65 and Over Under the Three Scenarios
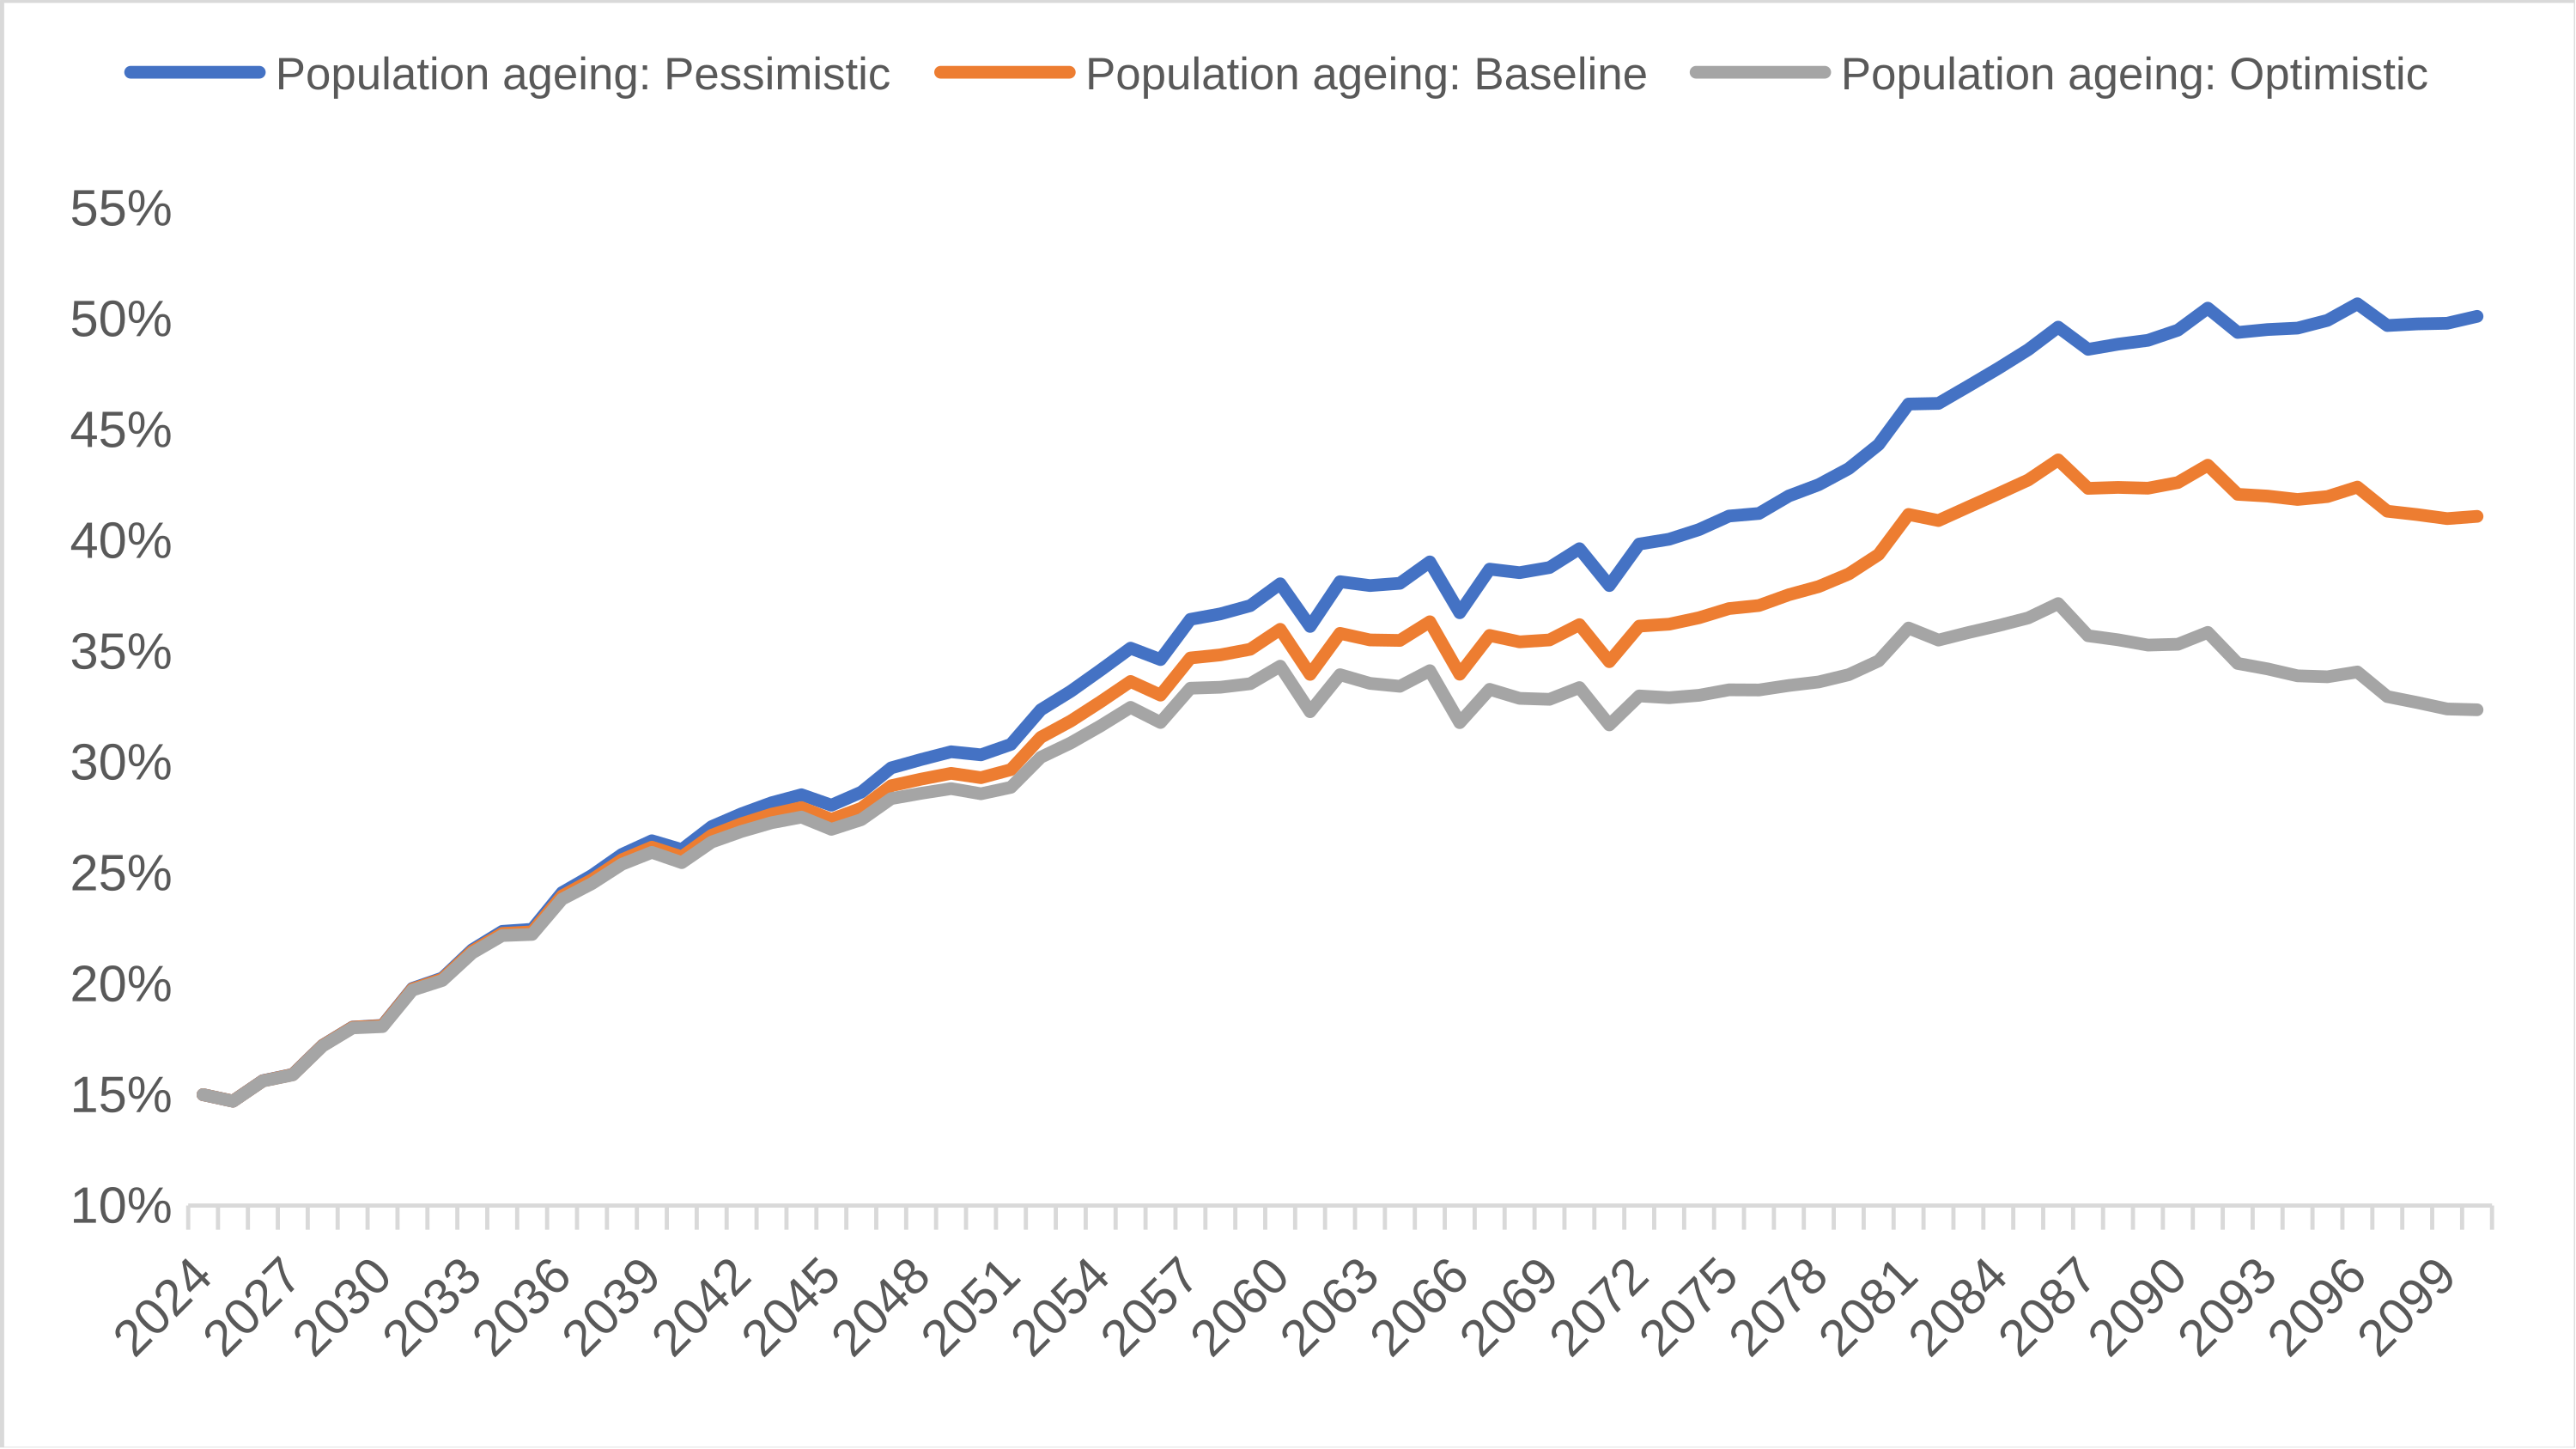
International comparisons underline the speed of China’s transition. China is projected to move from a deeply aged society to a super-aged society in only about ten years. The same transition took 36 years in Germany, 24 years in France, and 12 years in Japan. China is indeed ageing at an unusually rapid pace.
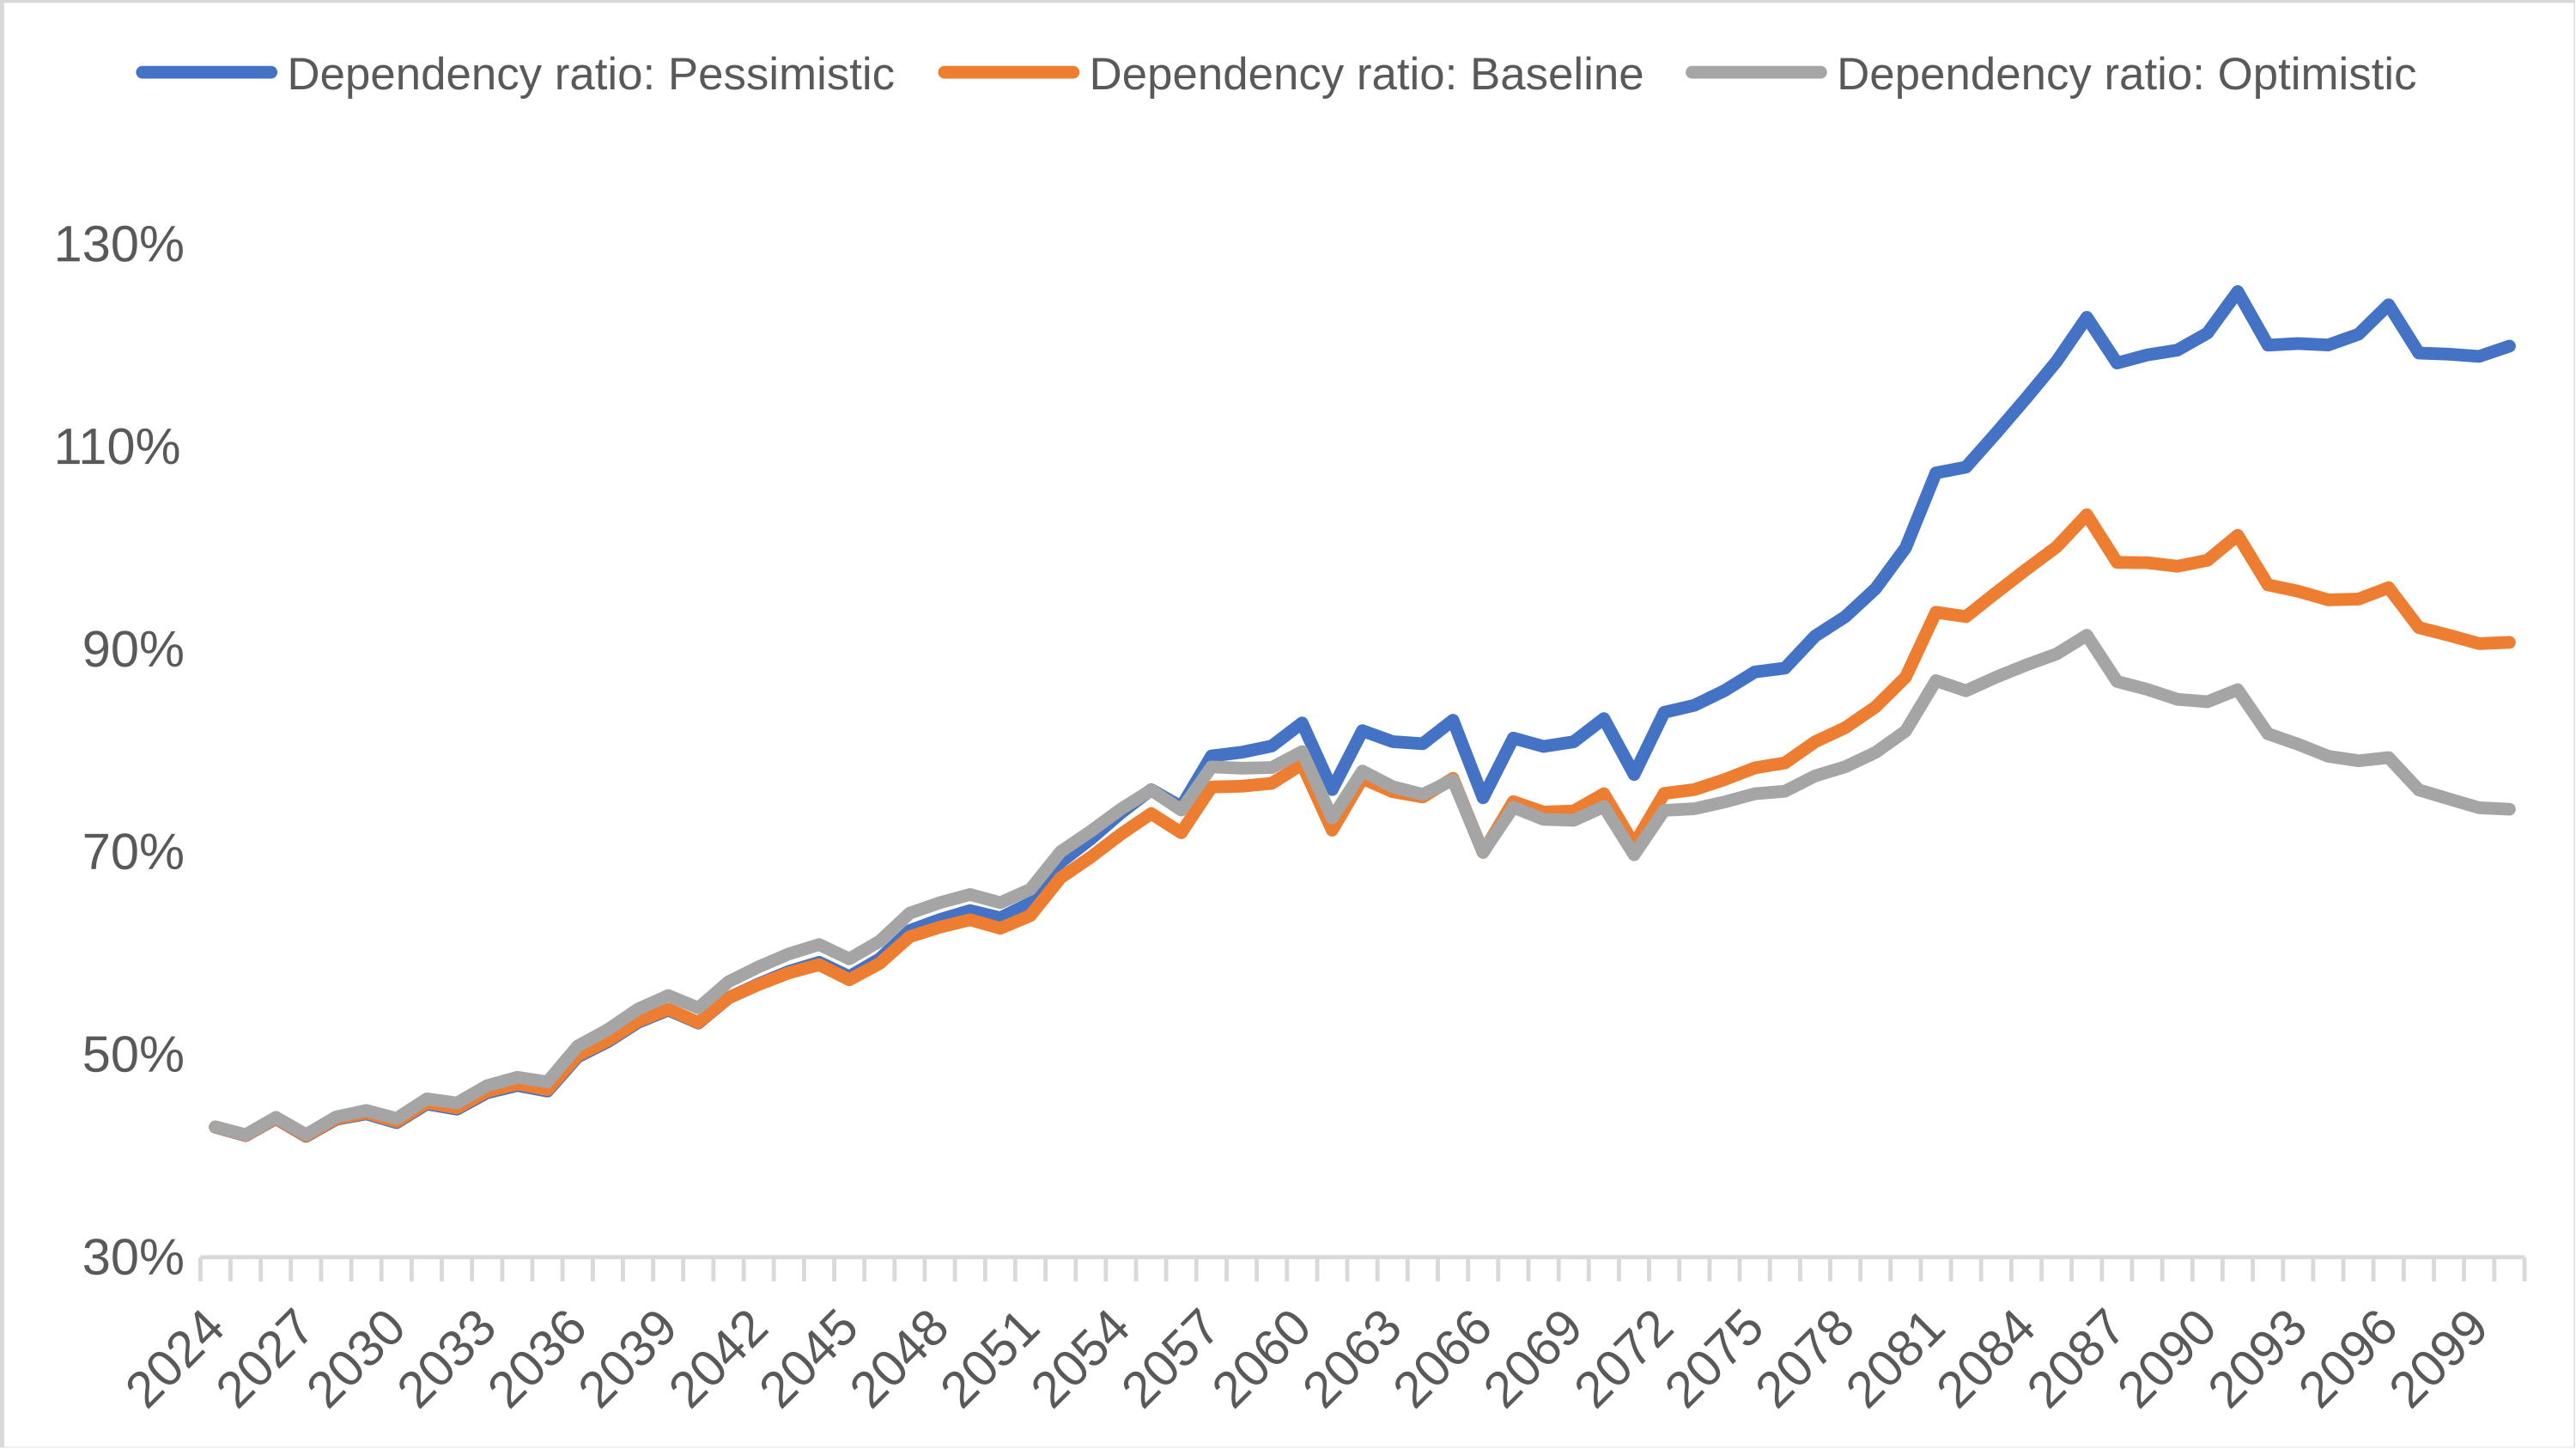
The dependency ratio rises sharply in all three scenarios until around 2060, levels off for roughly a decade, and then climbs again before peaking around 2085. Under the optimistic scenario, it reaches a high of about 91 per cent and then declines to roughly 74 per cent by 2100. Under the pessimistic scenario, it peaks at a dramatic 125 per cent and remains close to 120 per cent at the end of the century.
Figure 6. Projected Dependency Ratio Under the Three Scenarios
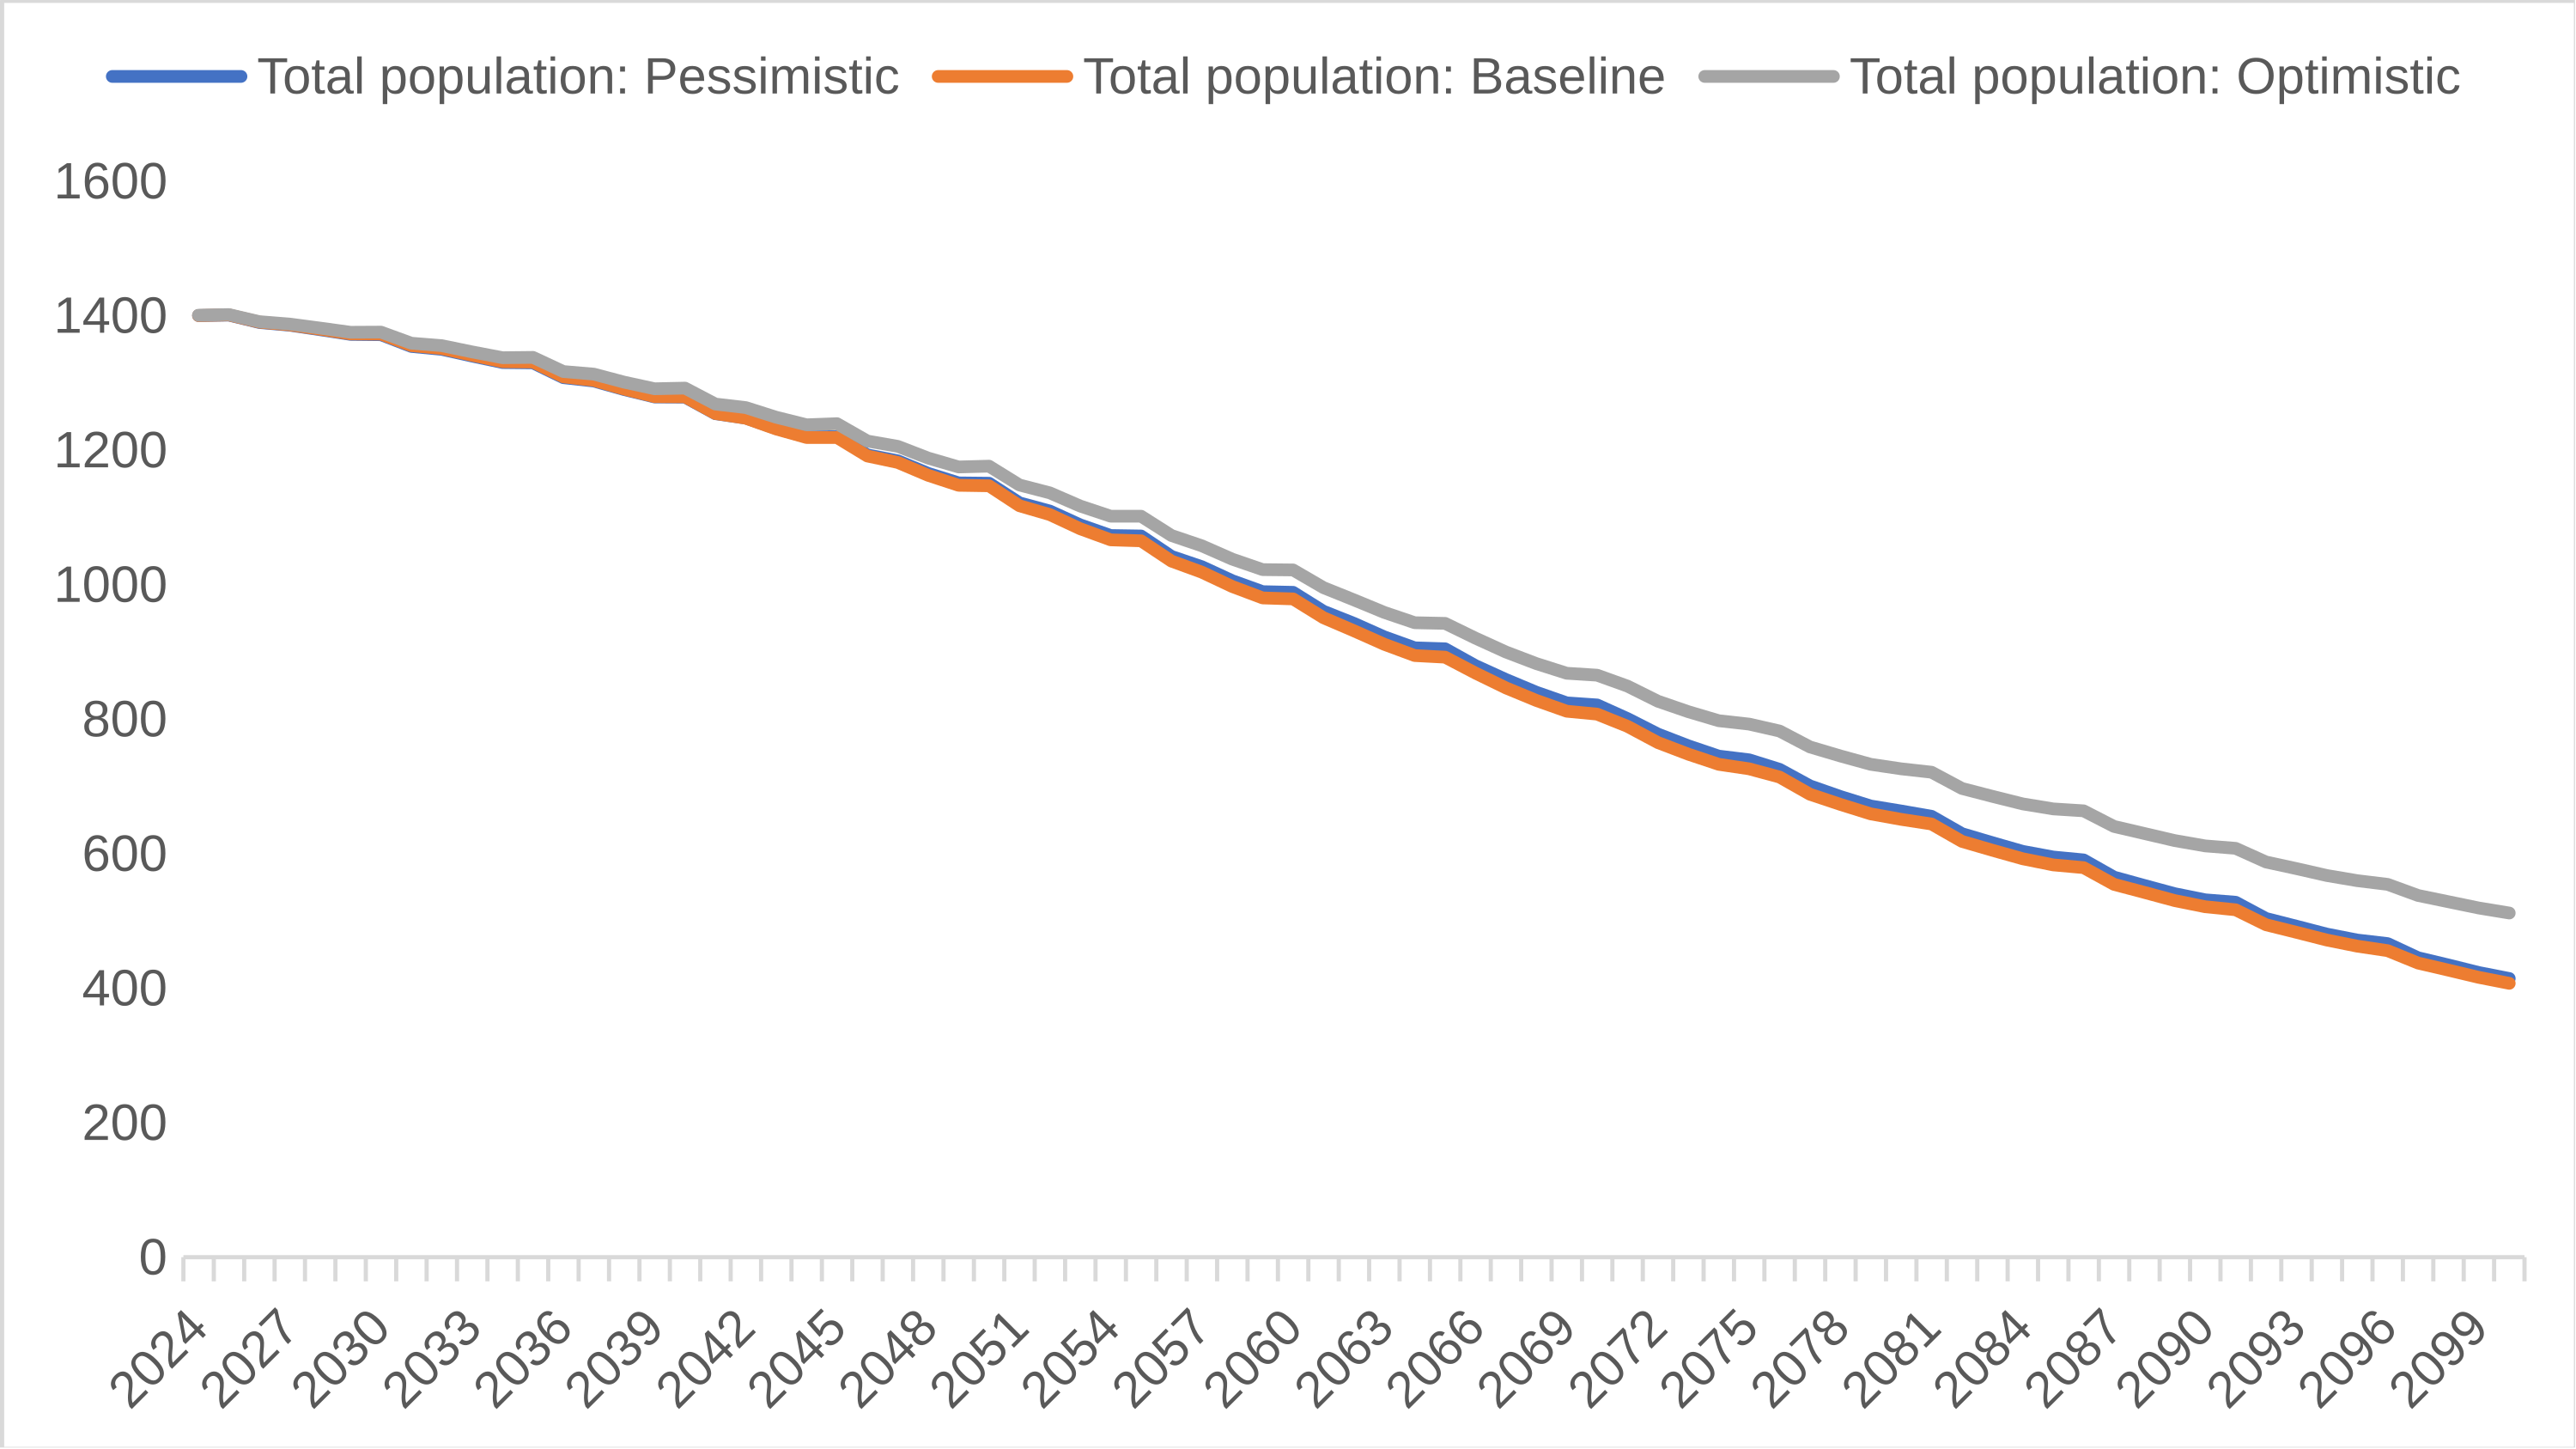
China’s total population declines substantially in every scenario. It is likely to fall below 1.4 billion within the next two years, below 1.3 billion around 2037, below 1.2 billion around 2050, below 1 billion around 2060, and below 800 million around 2070. By 2100, it falls to about 400 million in the baseline and pessimistic scenarios and to roughly 500 million even in the optimistic scenario.
Figure 7. Projected Total Population Under the Three Scenarios
Reflections on Raising China’s Fertility Rate
Low fertility is, to a large extent, a natural consequence of socioeconomic development. As discussed in Where Is China’s Population Headed? (2023 Edition), a clear international pattern links higher urbanisation and higher per capita income with lower fertility. It can be seen not only in affluent European countries and in Asian economies such as Japan and South Korea, but also in Muslim-majority countries such as the United Arab Emirates and Qatar. Low fertility therefore deserves serious attention and a sound policy response, but it should not be used to fuel unnecessary public anxiety.
Policies designed to encourage childbearing may be more effective in rural areas and small towns. The inverse relationship between urbanisation and fertility suggests that raising fertility may be easier in these areas, where the pressures of daily life are generally less acute than in major cities. According to China’s Seventh National Population Census in 2020, the total fertility rate was about 1.20 in urban areas and 1.54 in rural areas. Rural China’s fertility advantage came mainly from higher rates of second, third, and subsequent births. Addressing the difficulties faced by older single men in rural areas in finding suitable partners is also closely linked to efforts to raise fertility.
Policies that support second and subsequent births may also be more effective than policies focused mainly on first births. Where Is China’s Population Headed? (2025 Concise Edition) compared age-specific fertility rates in China with those in Japan, France, England and Wales, and Scotland. China’s fertility rates among women aged 15–19, 20–24, and 25–29 were clearly higher, while fertility among women aged 30–34, 35–39, and 40–44 was markedly lower. Women in China also have their first child at a younger age on average, while the proportions who remain unmarried or childless throughout their lives are much lower than in Europe, Japan, and other developed economies. Taken together, these patterns suggest that China’s lower fertility is driven mostly by low rates of second and subsequent births.
International experience also shows that as economies become more developed and societies become more open, individuals gain greater freedom in decisions, and more people choose not to marry or have children. Policies aimed at persuading this group to marry and become parents are unlikely to be as effective as measures that help families who already want children to have a second or third child. Supporting policies should therefore reduce the financial and practical burden on larger families.
Gender imbalance may be another major constraint on a fertility recovery. As noted in Where Is China’s Population Headed? (2023 Edition), among those born between 2006 and 2010 — now roughly 16 to 20 years old and likely to enter marriageable age over the next five years — there were about 20 per cent more males than females. The gap narrowed among later birth cohorts but remained more than 115 boys for every 100 girls until 2016, when it began to move back toward 105:100.
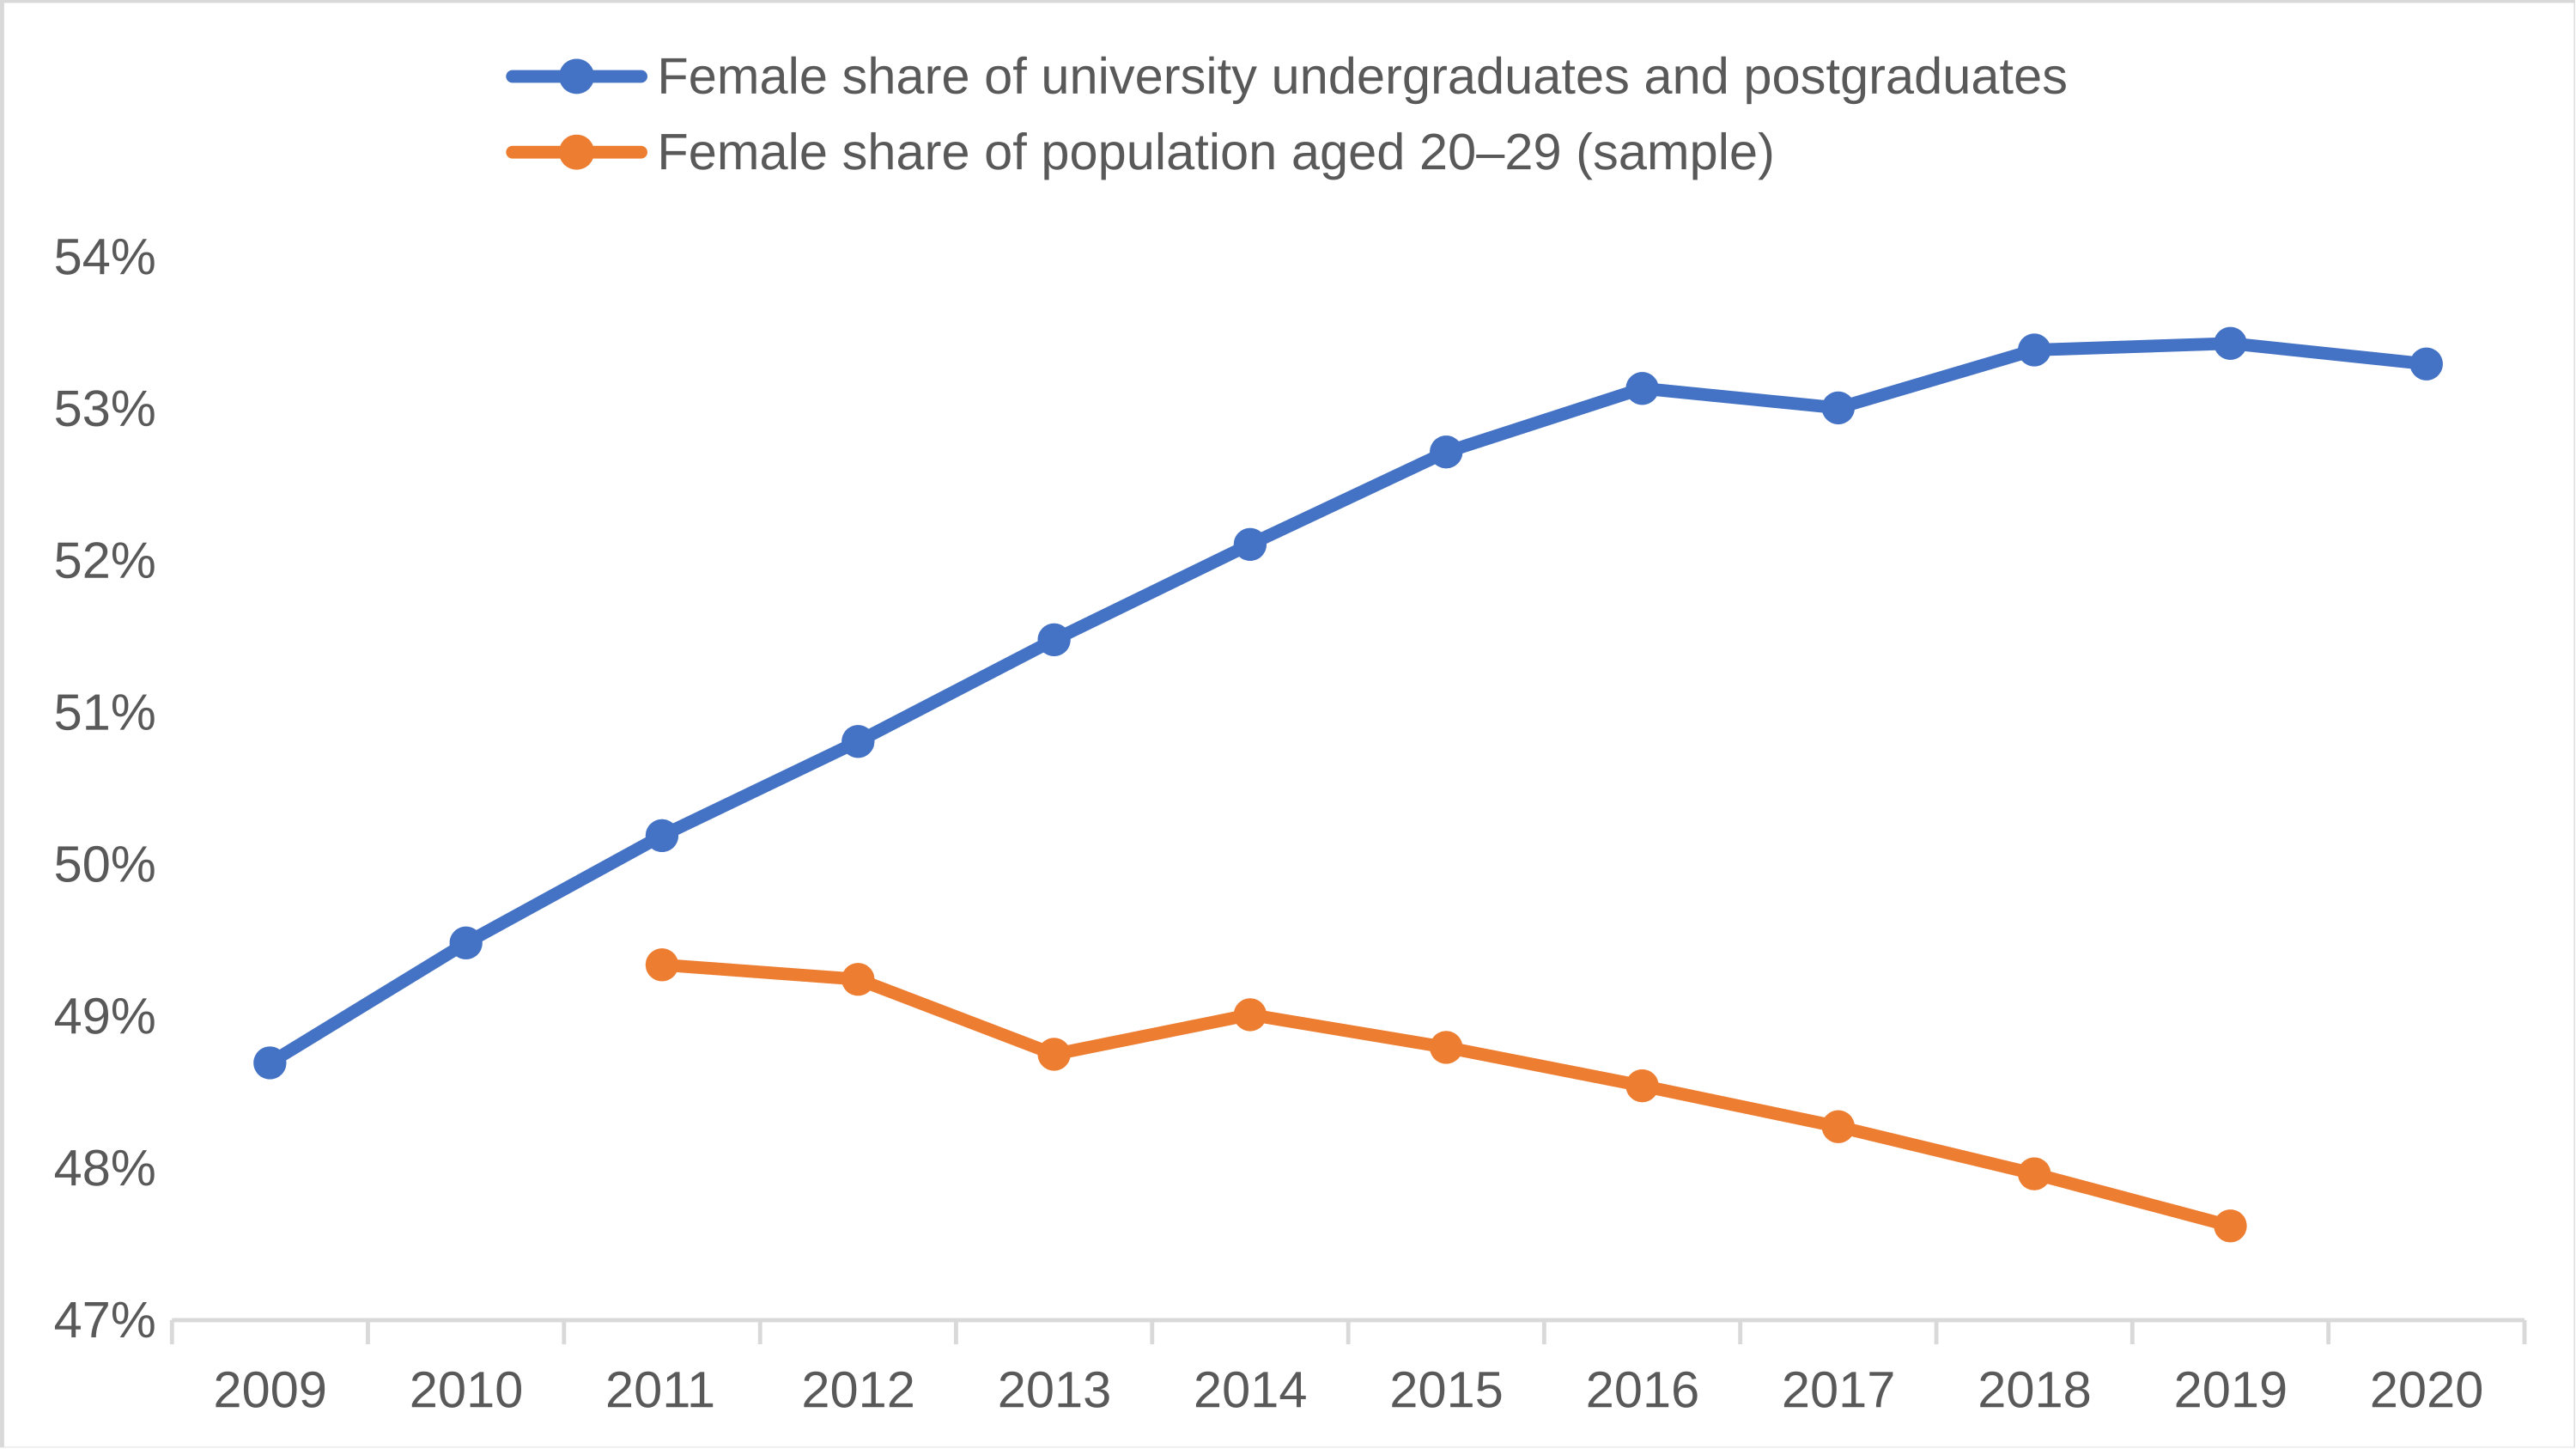
The cohorts entering marriage and childbearing age over the next decade will therefore remain significantly imbalanced by sex. Differences in educational attainment make the matching problem even more complex. As shown in Figure 8, women’s share of undergraduate and postgraduate enrolment rose steadily and remained above 50 per cent after 2011. Yet women account for less than half of the overall population aged 20–29, and their share in this age group continues to fall.
Among children born between 2006 and 2015, the sex ratio remained consistently above 115 boys for every 100 girls, and exceeded 120:100 between 2006 and 2010. From around 2031, these cohorts may begin moving into the key childbearing ages of 25–34. The imbalance is likely to have a visible effect on both marriage and fertility rates.
Women make up a larger share of highly educated groups even though they account for a smaller share of the total population. This means that the gender imbalance is even more pronounced among people with lower levels of education. Men with less education — especially those in rural areas and small towns — may find it increasingly difficult to find suitable partners. At the same time, traditional expectations often lead women to seek partners with equal or higher educational attainment and socioeconomic status, which can make partner matching difficult for highly educated women as well. Addressing these structural obstacles to marriage will be crucial to efforts to raise fertility.
Figure 8. Women Account for a Larger Share of Undergraduate and Postgraduate Students
Urbanisation Is Slowing
The Pace of Urbanisation Is Losing Momentum
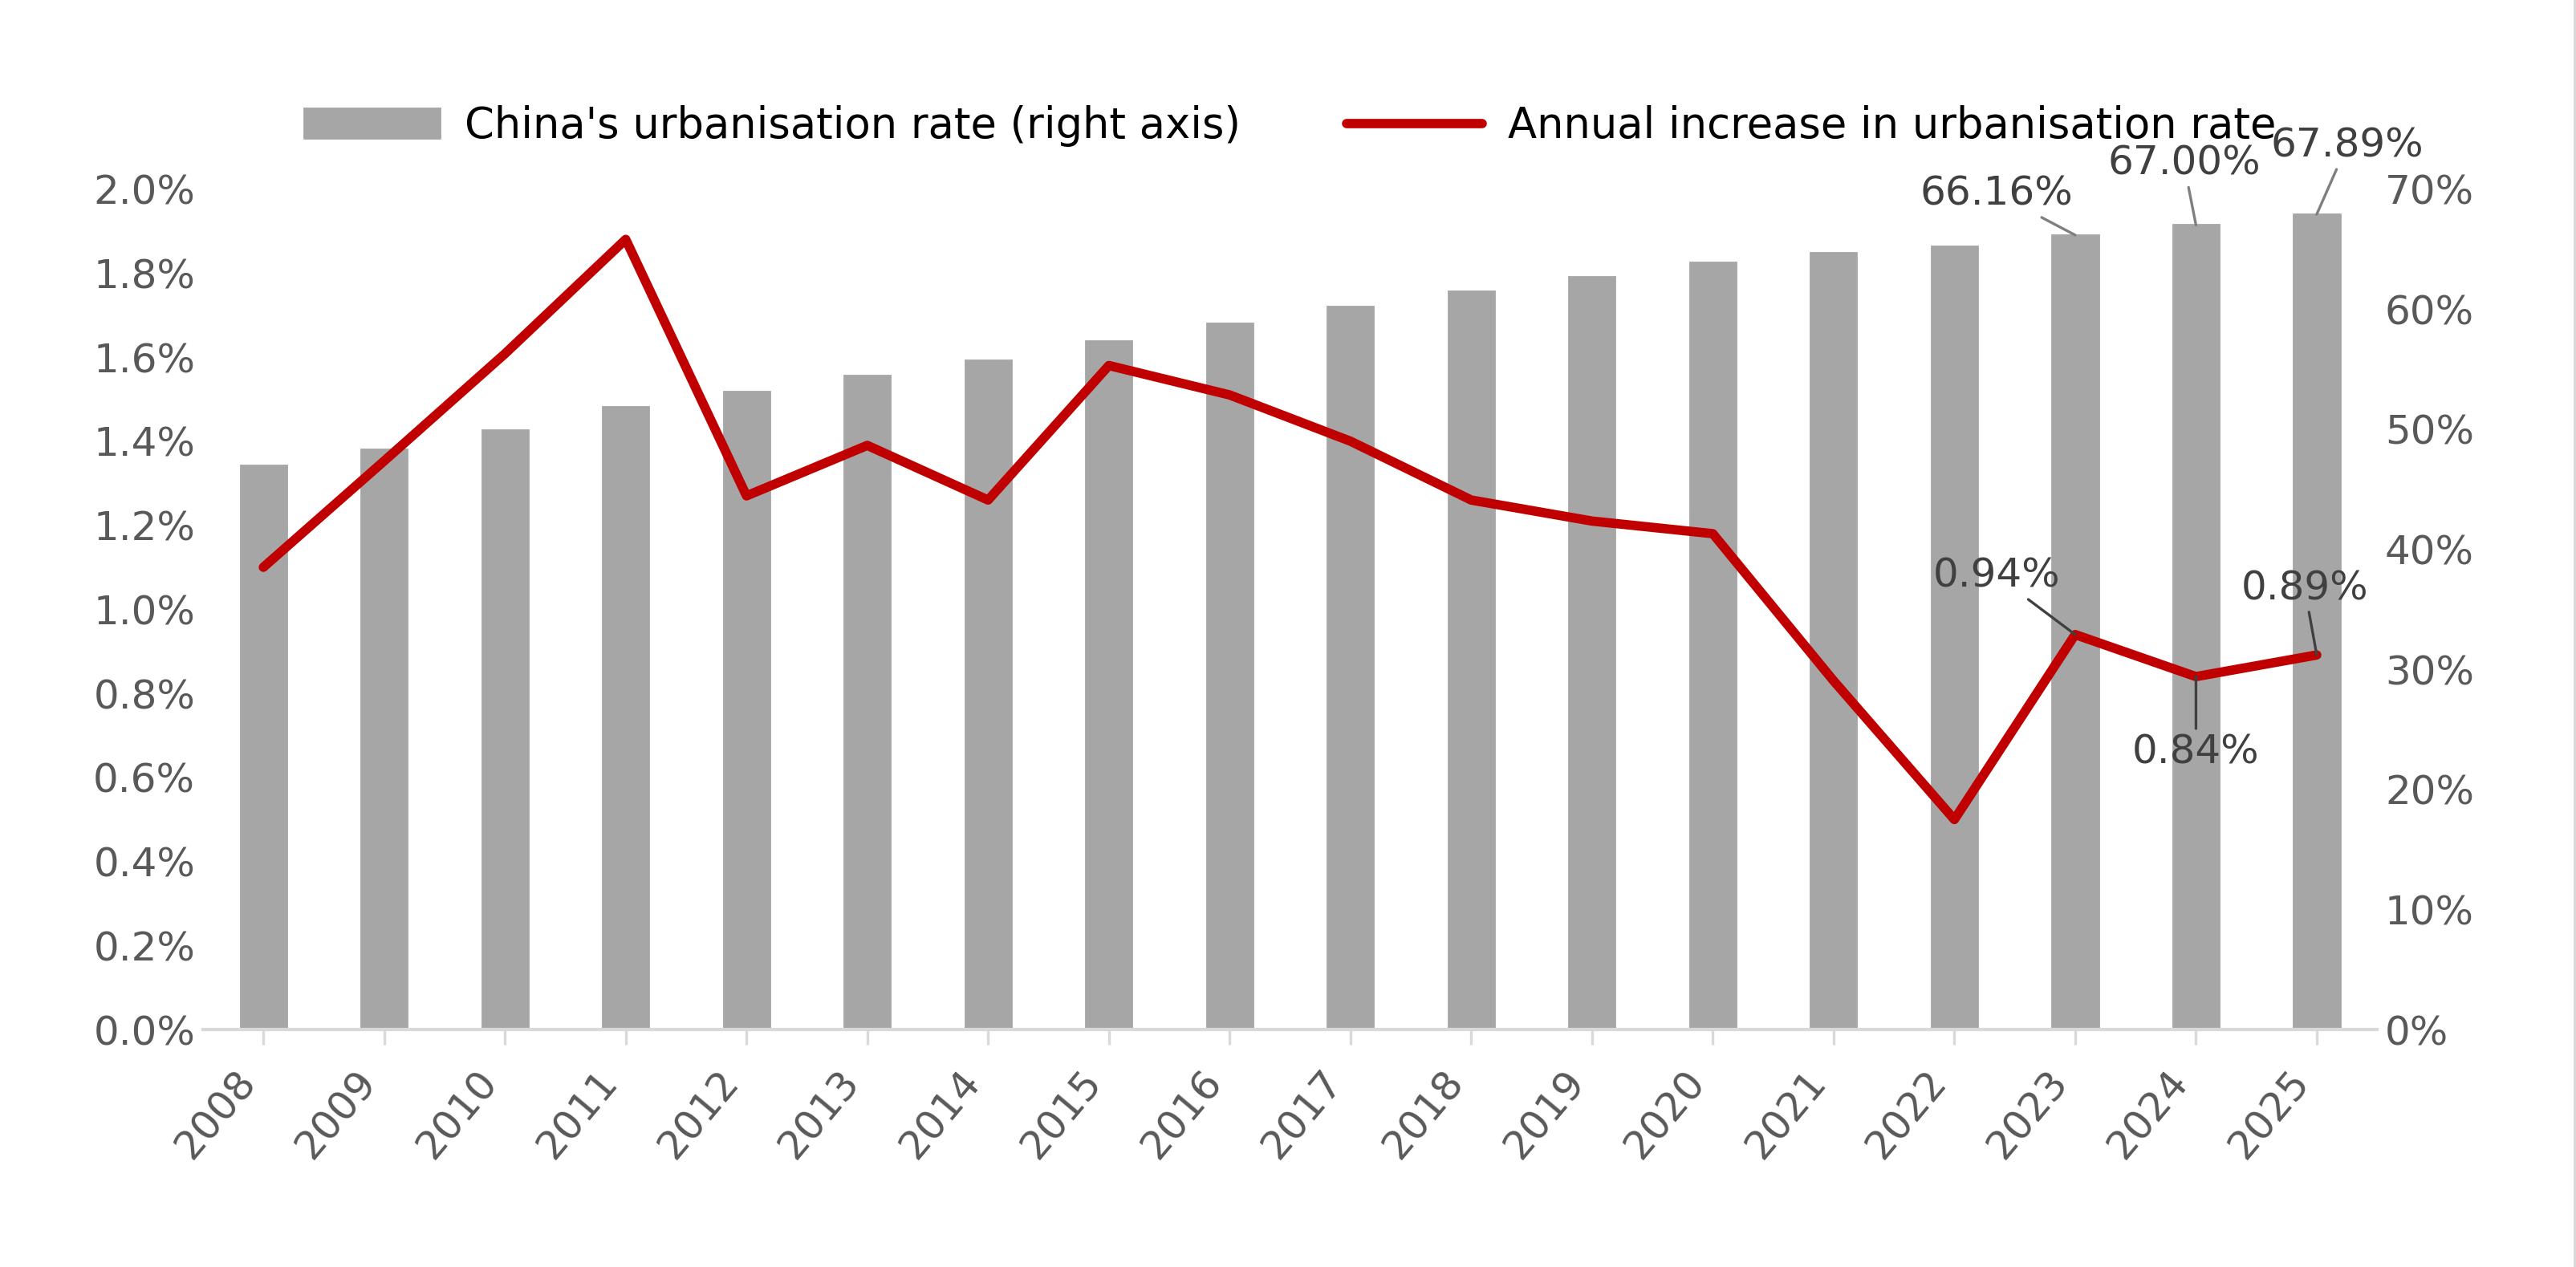
China’s urbanisation rate rose to 67.89 per cent in 2025, but the pace of increase has slowed markedly. Between 2012 and 2020, the urban share of the population rose by an average of 1.34 percentage points a year. Since it passed 64 per cent in 2021, however, the average annual increase over the past five years has fallen to just 0.80 percentage points. At that pace, China’s urbanisation rate will pass the theoretical turning point of 70 per cent around 2028 and enter a more mature phase in which annual gains continue to slow.
Figure 9. China’s Urbanisation Is Slowing
Among 337 Chinese cities classified as fifth-tier or above, 185 recorded a decline in their resident population between 2024 and 2025 — more than half of the total. (Because city-level data remain incomplete, these figures have not been adjusted for natural population change.) A further 65 cities had not yet released resident-population data for 2025. Most of the cities losing population were third-tier or lower, indicating that urbanisation is becoming difficult for small and medium-sized cities.
Figures 10–11. Changes in Resident Population Across Chinese Cities in 2025
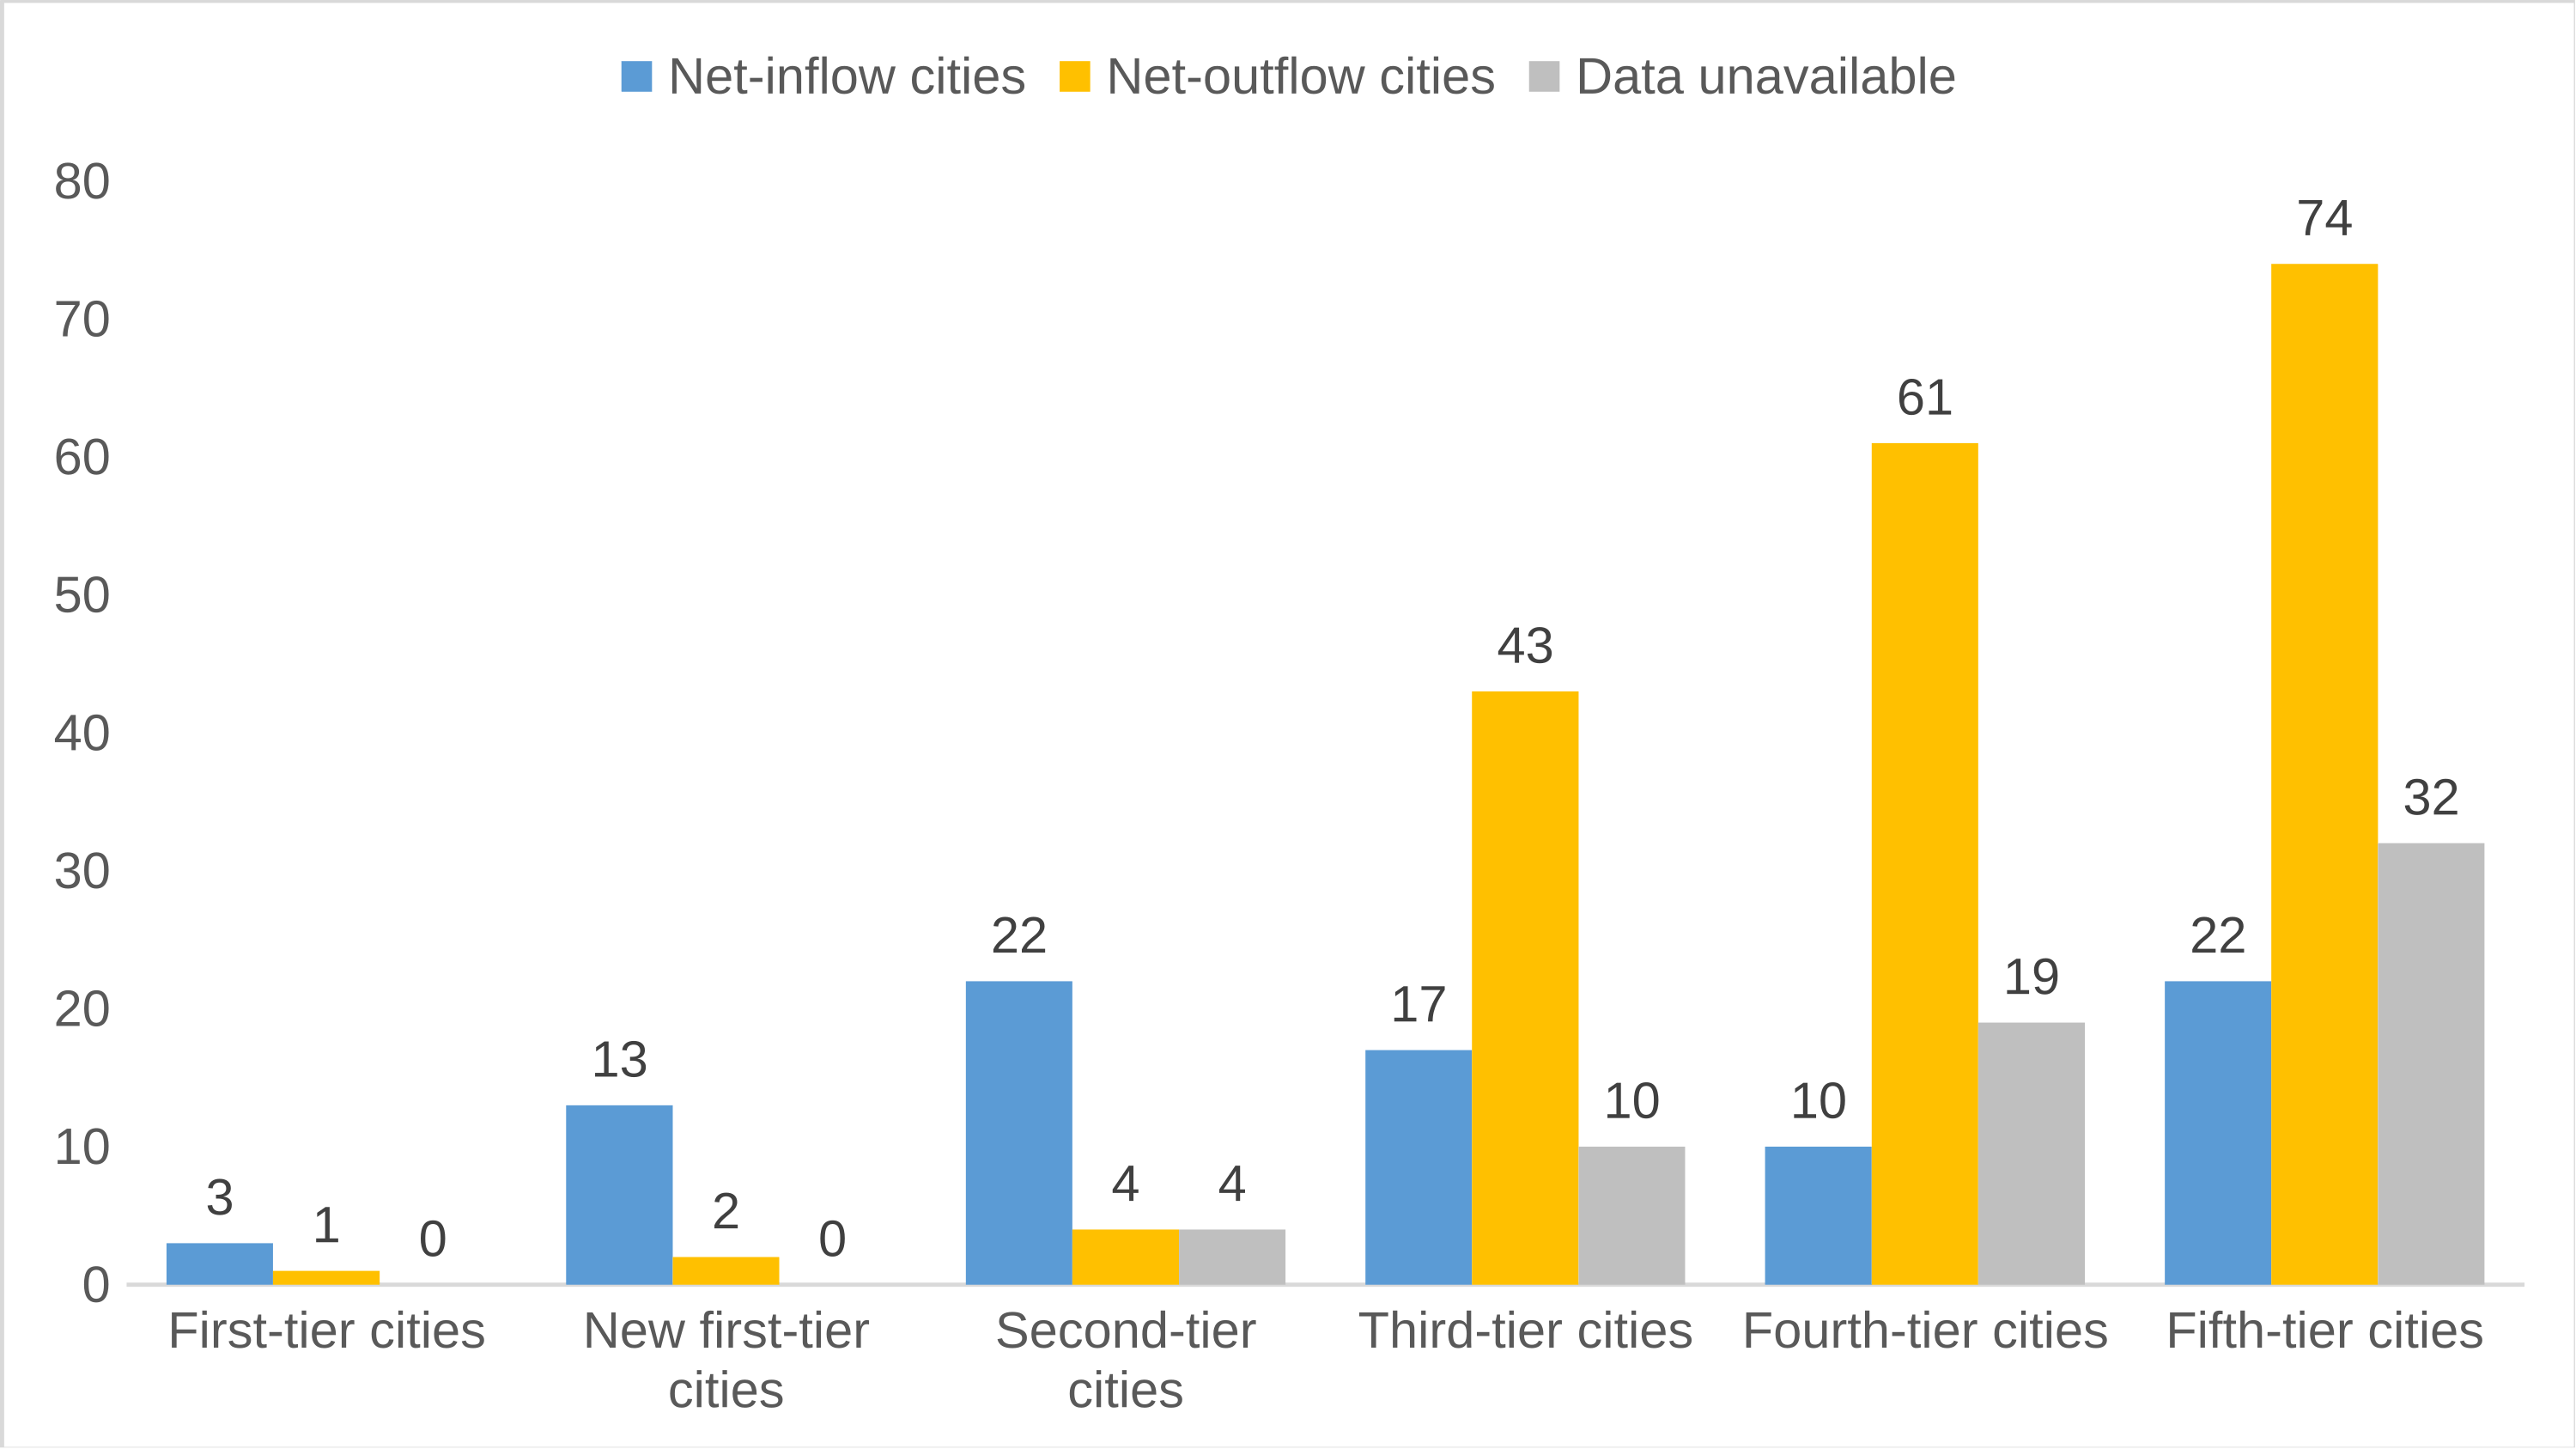
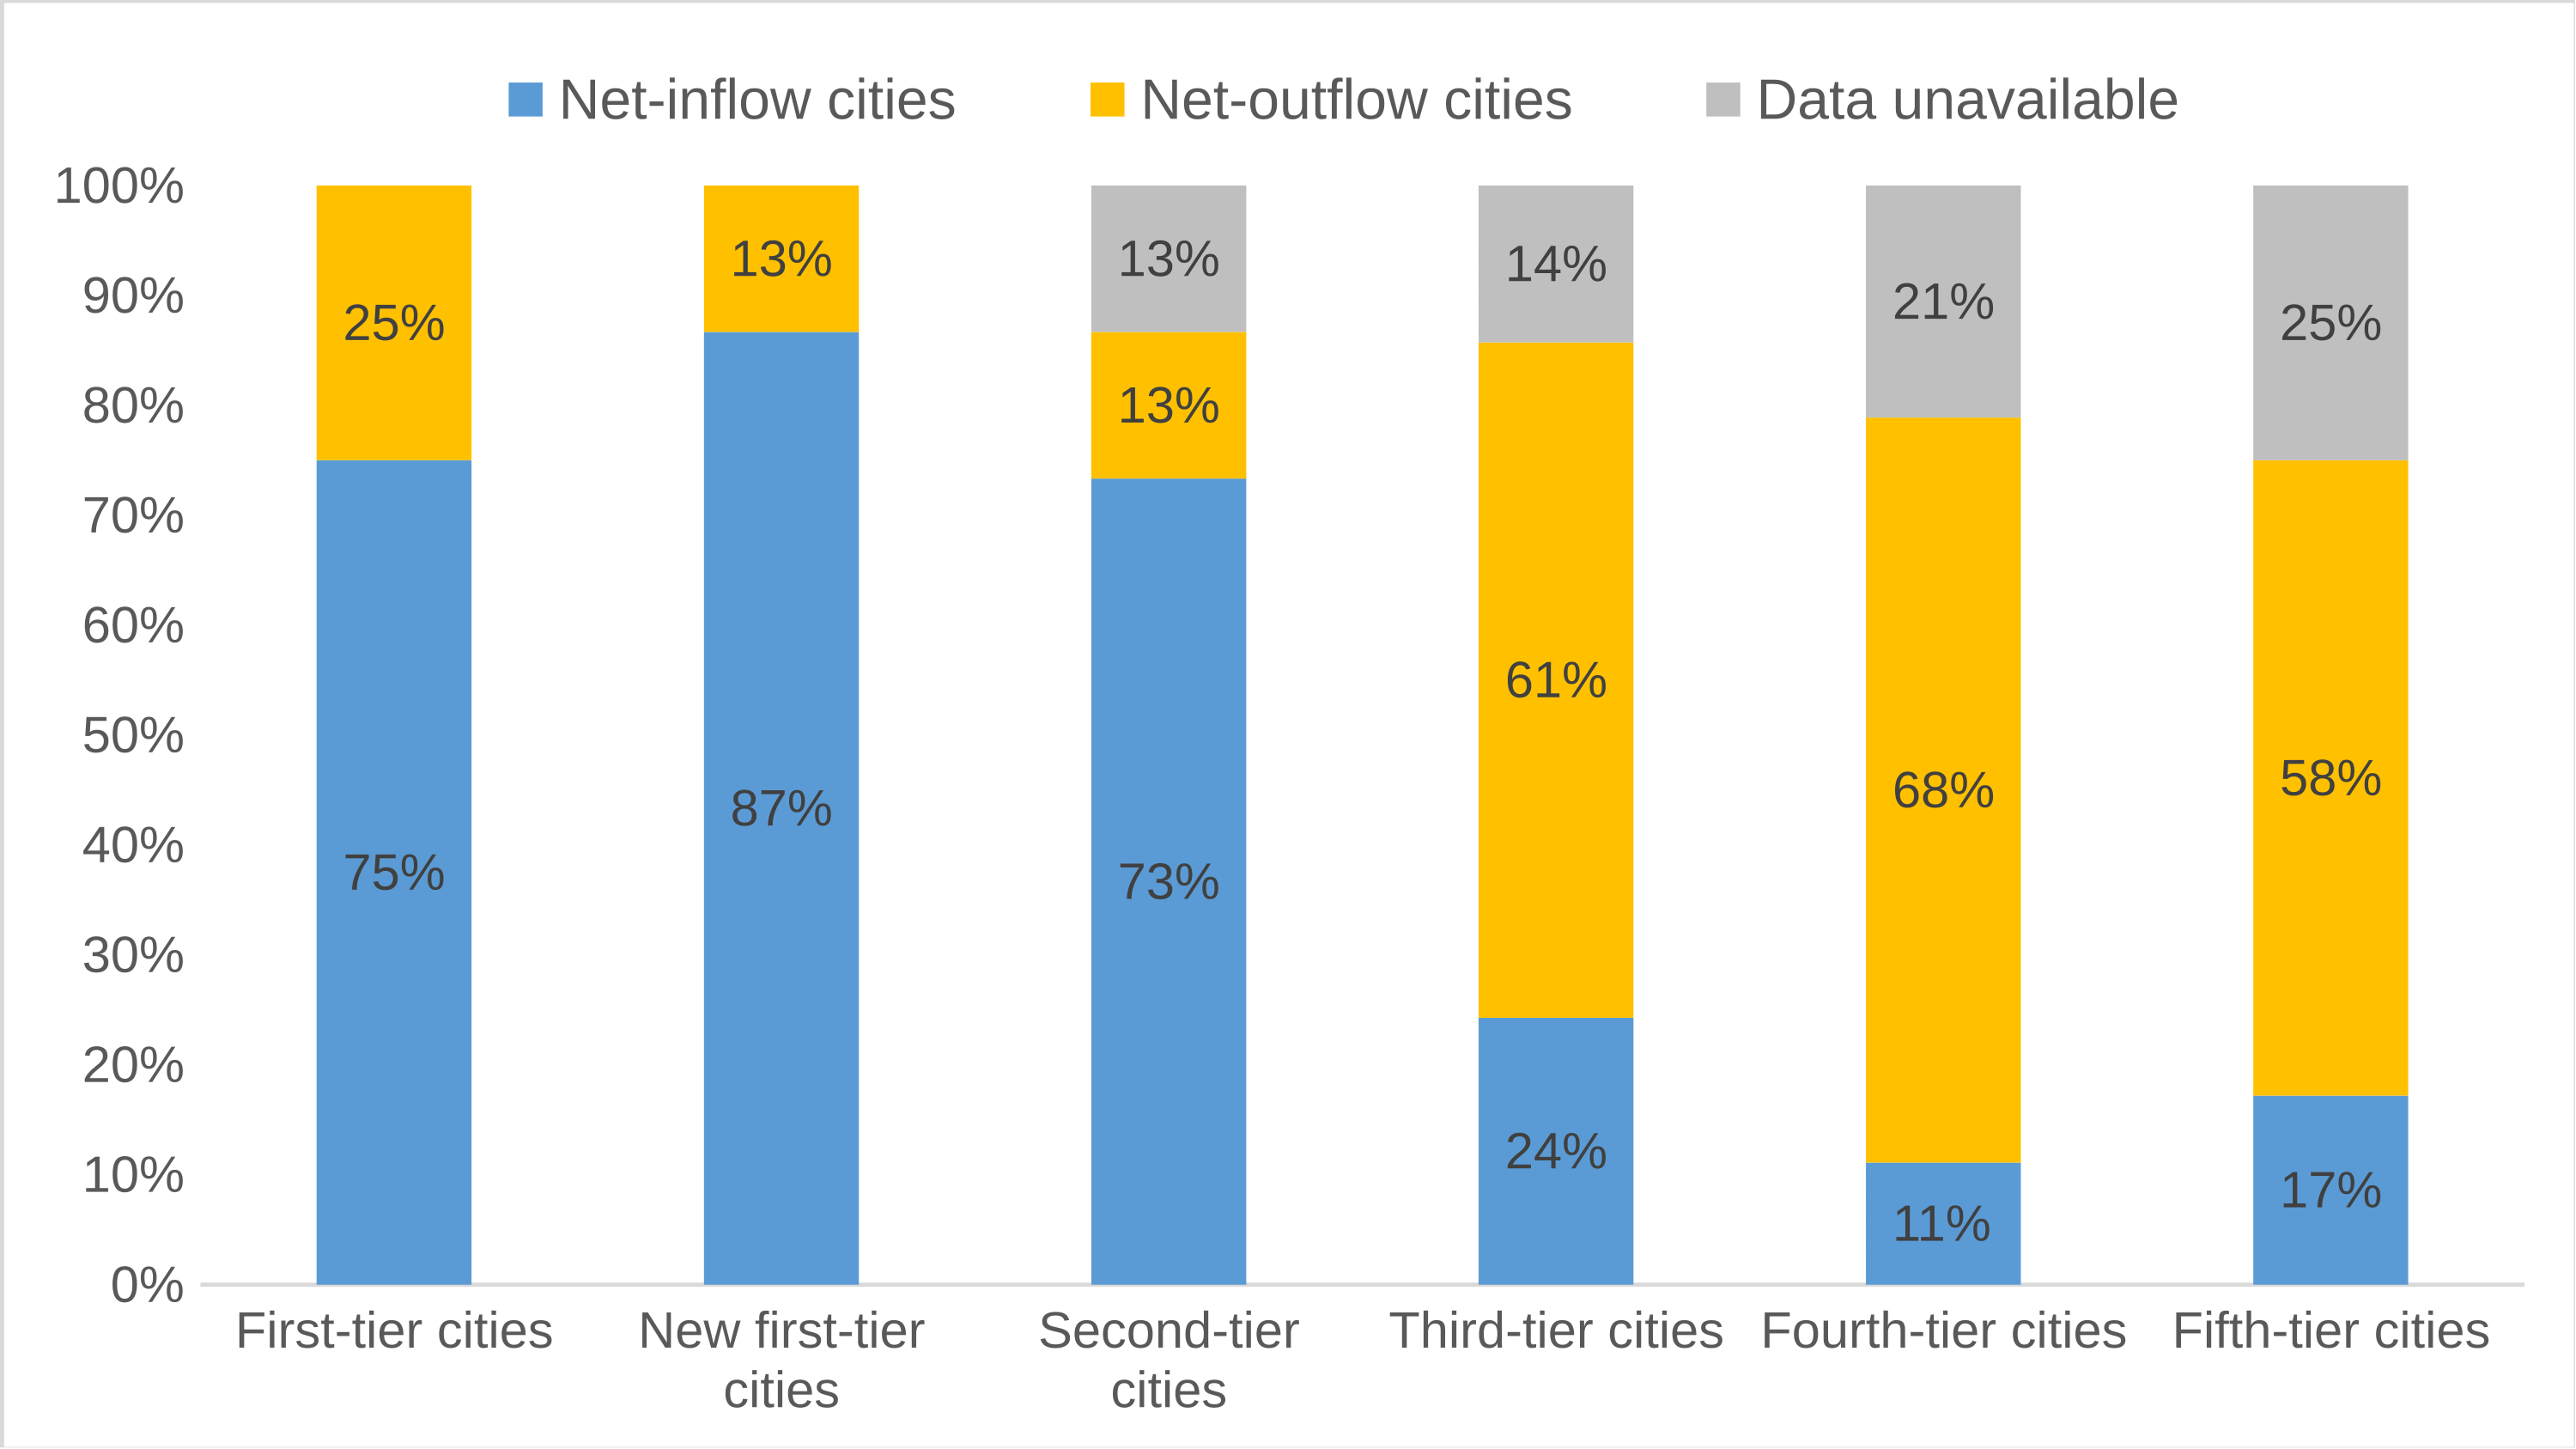
Note: The city tiers follow the 2025 Ranking of China’s New First-Tier Cities, released in May 2025 by Yicai’s New First-Tier Cities Research Institute. The ranking evaluates cities on five dimensions: concentration of commercial resources, strength as transport and business hubs, urban vitality, competitiveness in the new economy, and future potential. It draws on multiple sources of big data, including branded-store networks and patterns of internet use.
Migrant Workers Are Becoming Less Mobile
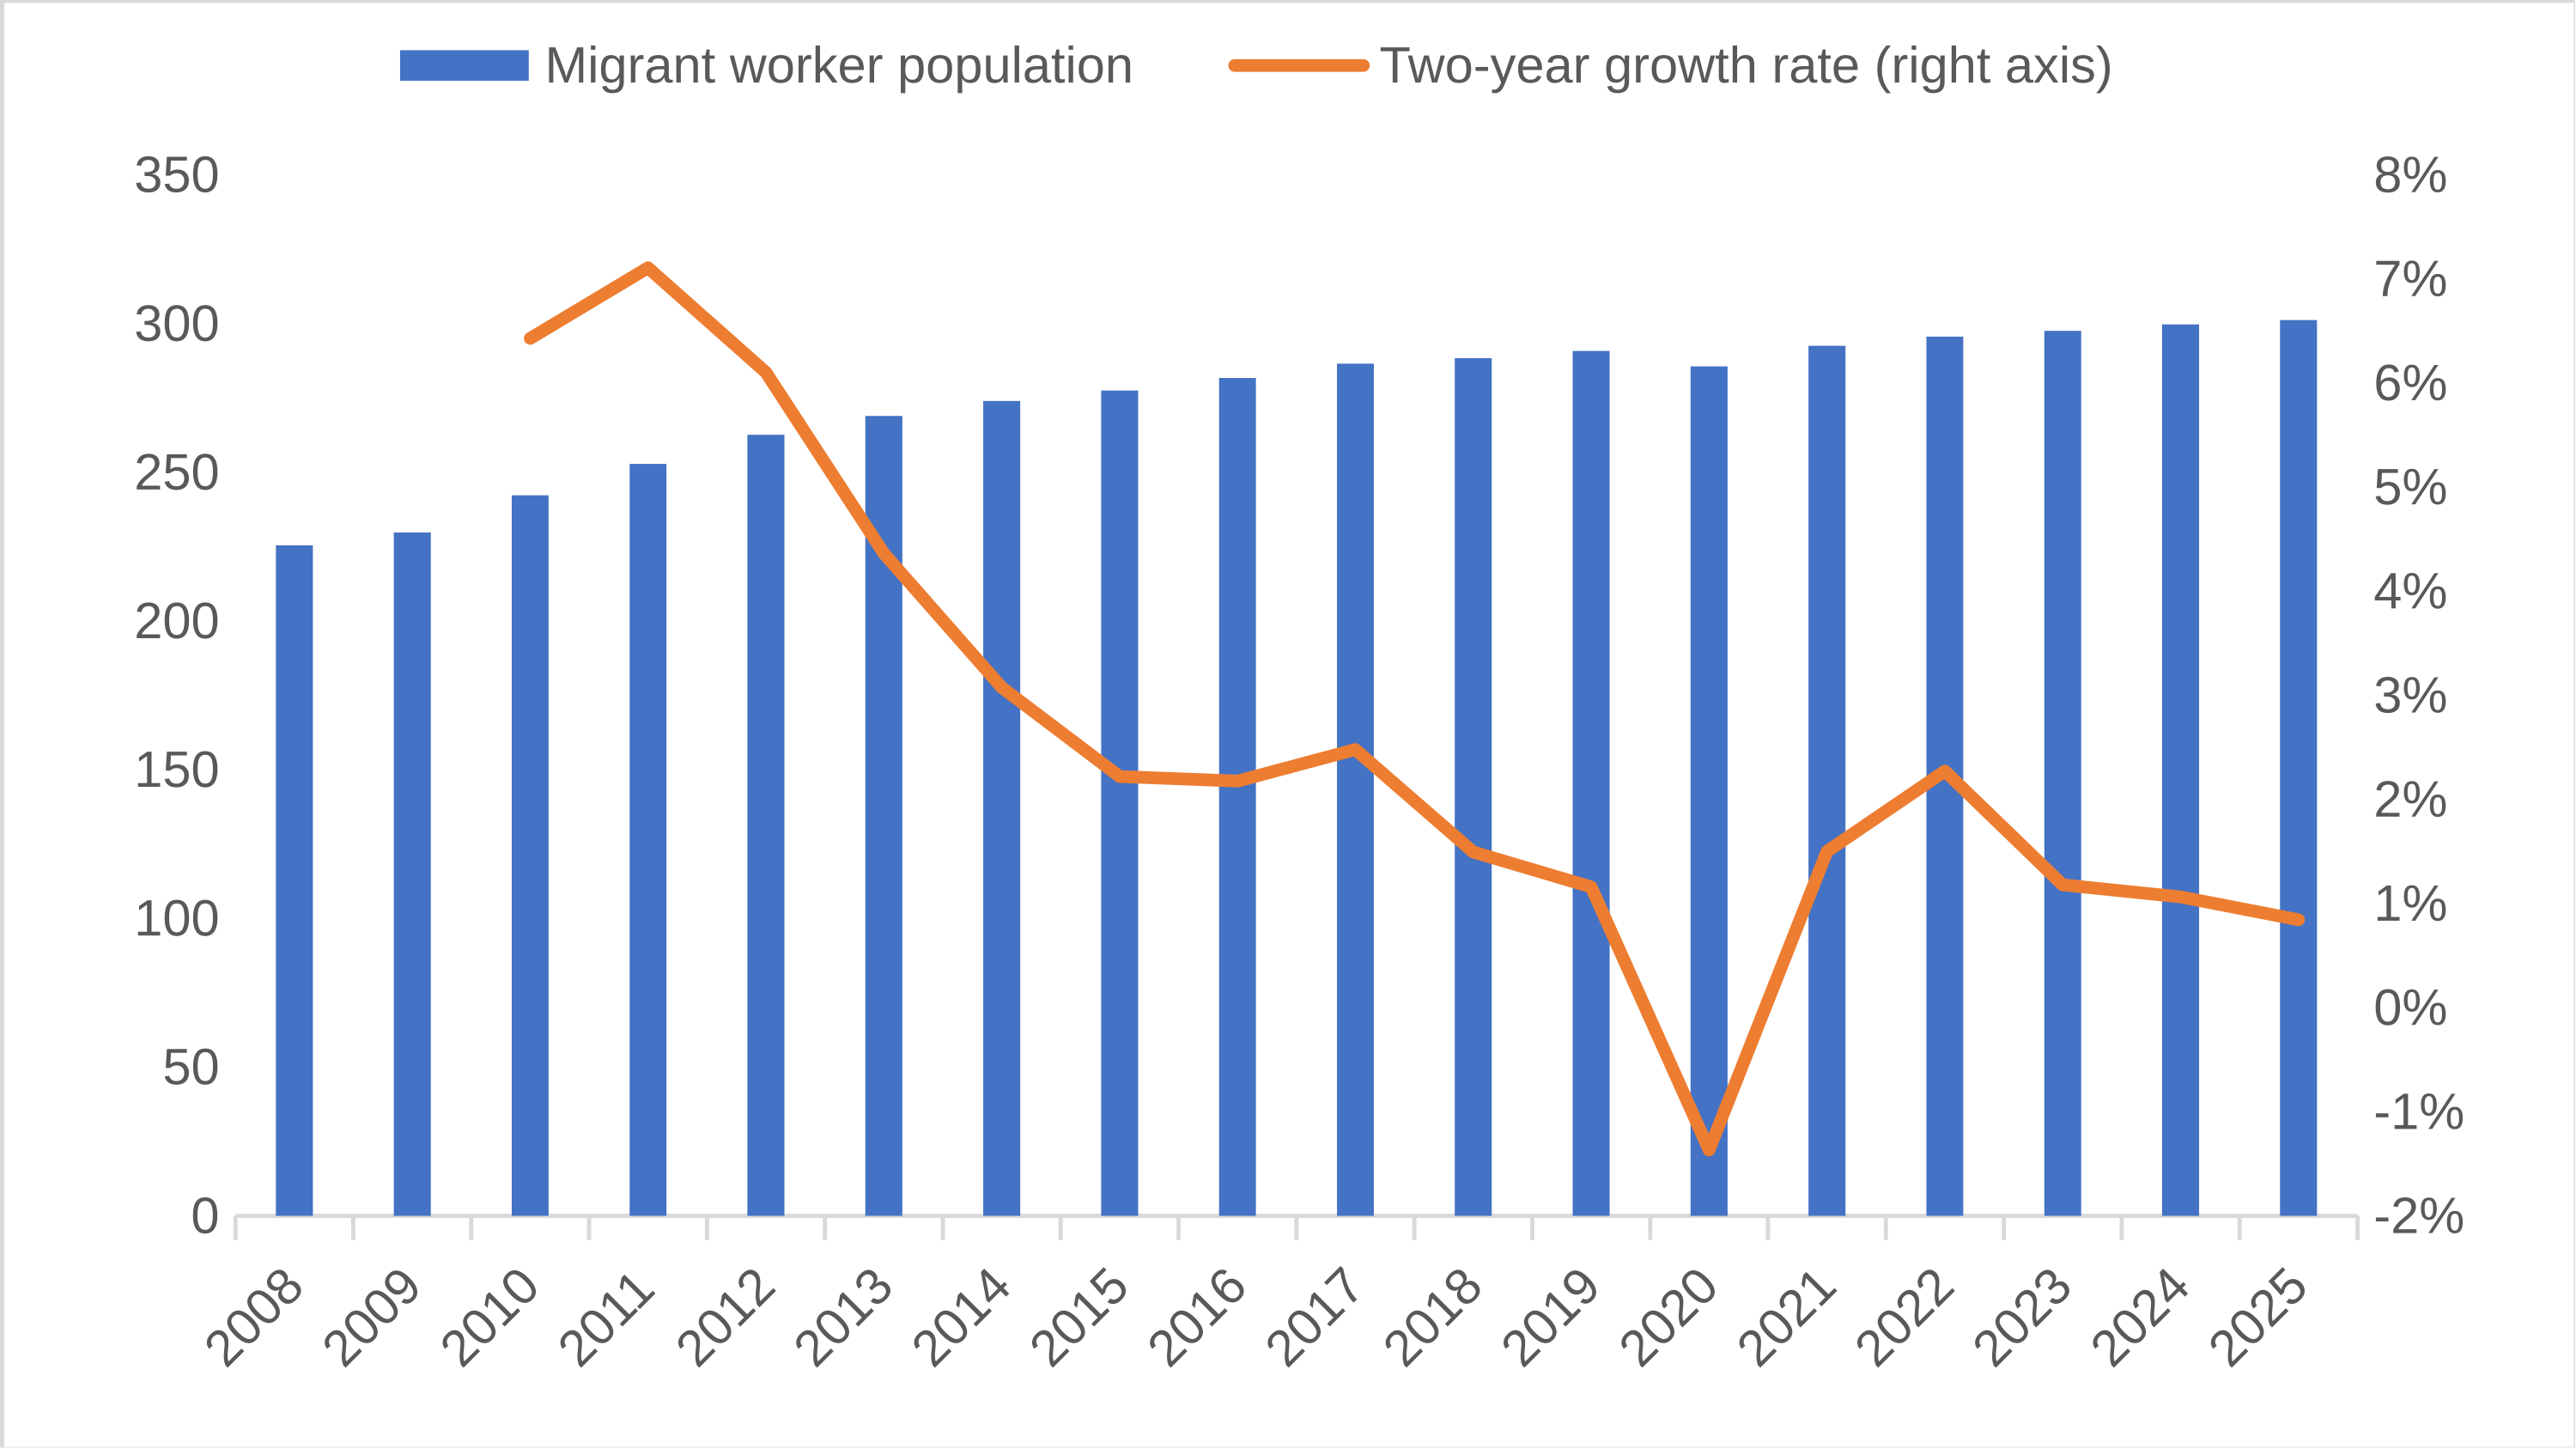
During the 2010s, China’s migrant-worker population increased by more than five million a year. Large-scale, one-way movement from the countryside to cities was the main force behind rapid urban expansion. By 2025, however, the total number of migrant workers stood at 301.15 million, only 1.42 million more than a year earlier, for growth of just 0.5 per cent. Of the total, 121.09 million worked within their local townships, an increase of 70,000, or 0.1 per cent. A further 180.06 million worked away from home townships, up by 1.35 million, or 0.8 per cent.
Figure 12. Growth in China’s Migrant-Worker Population Continues to Slow
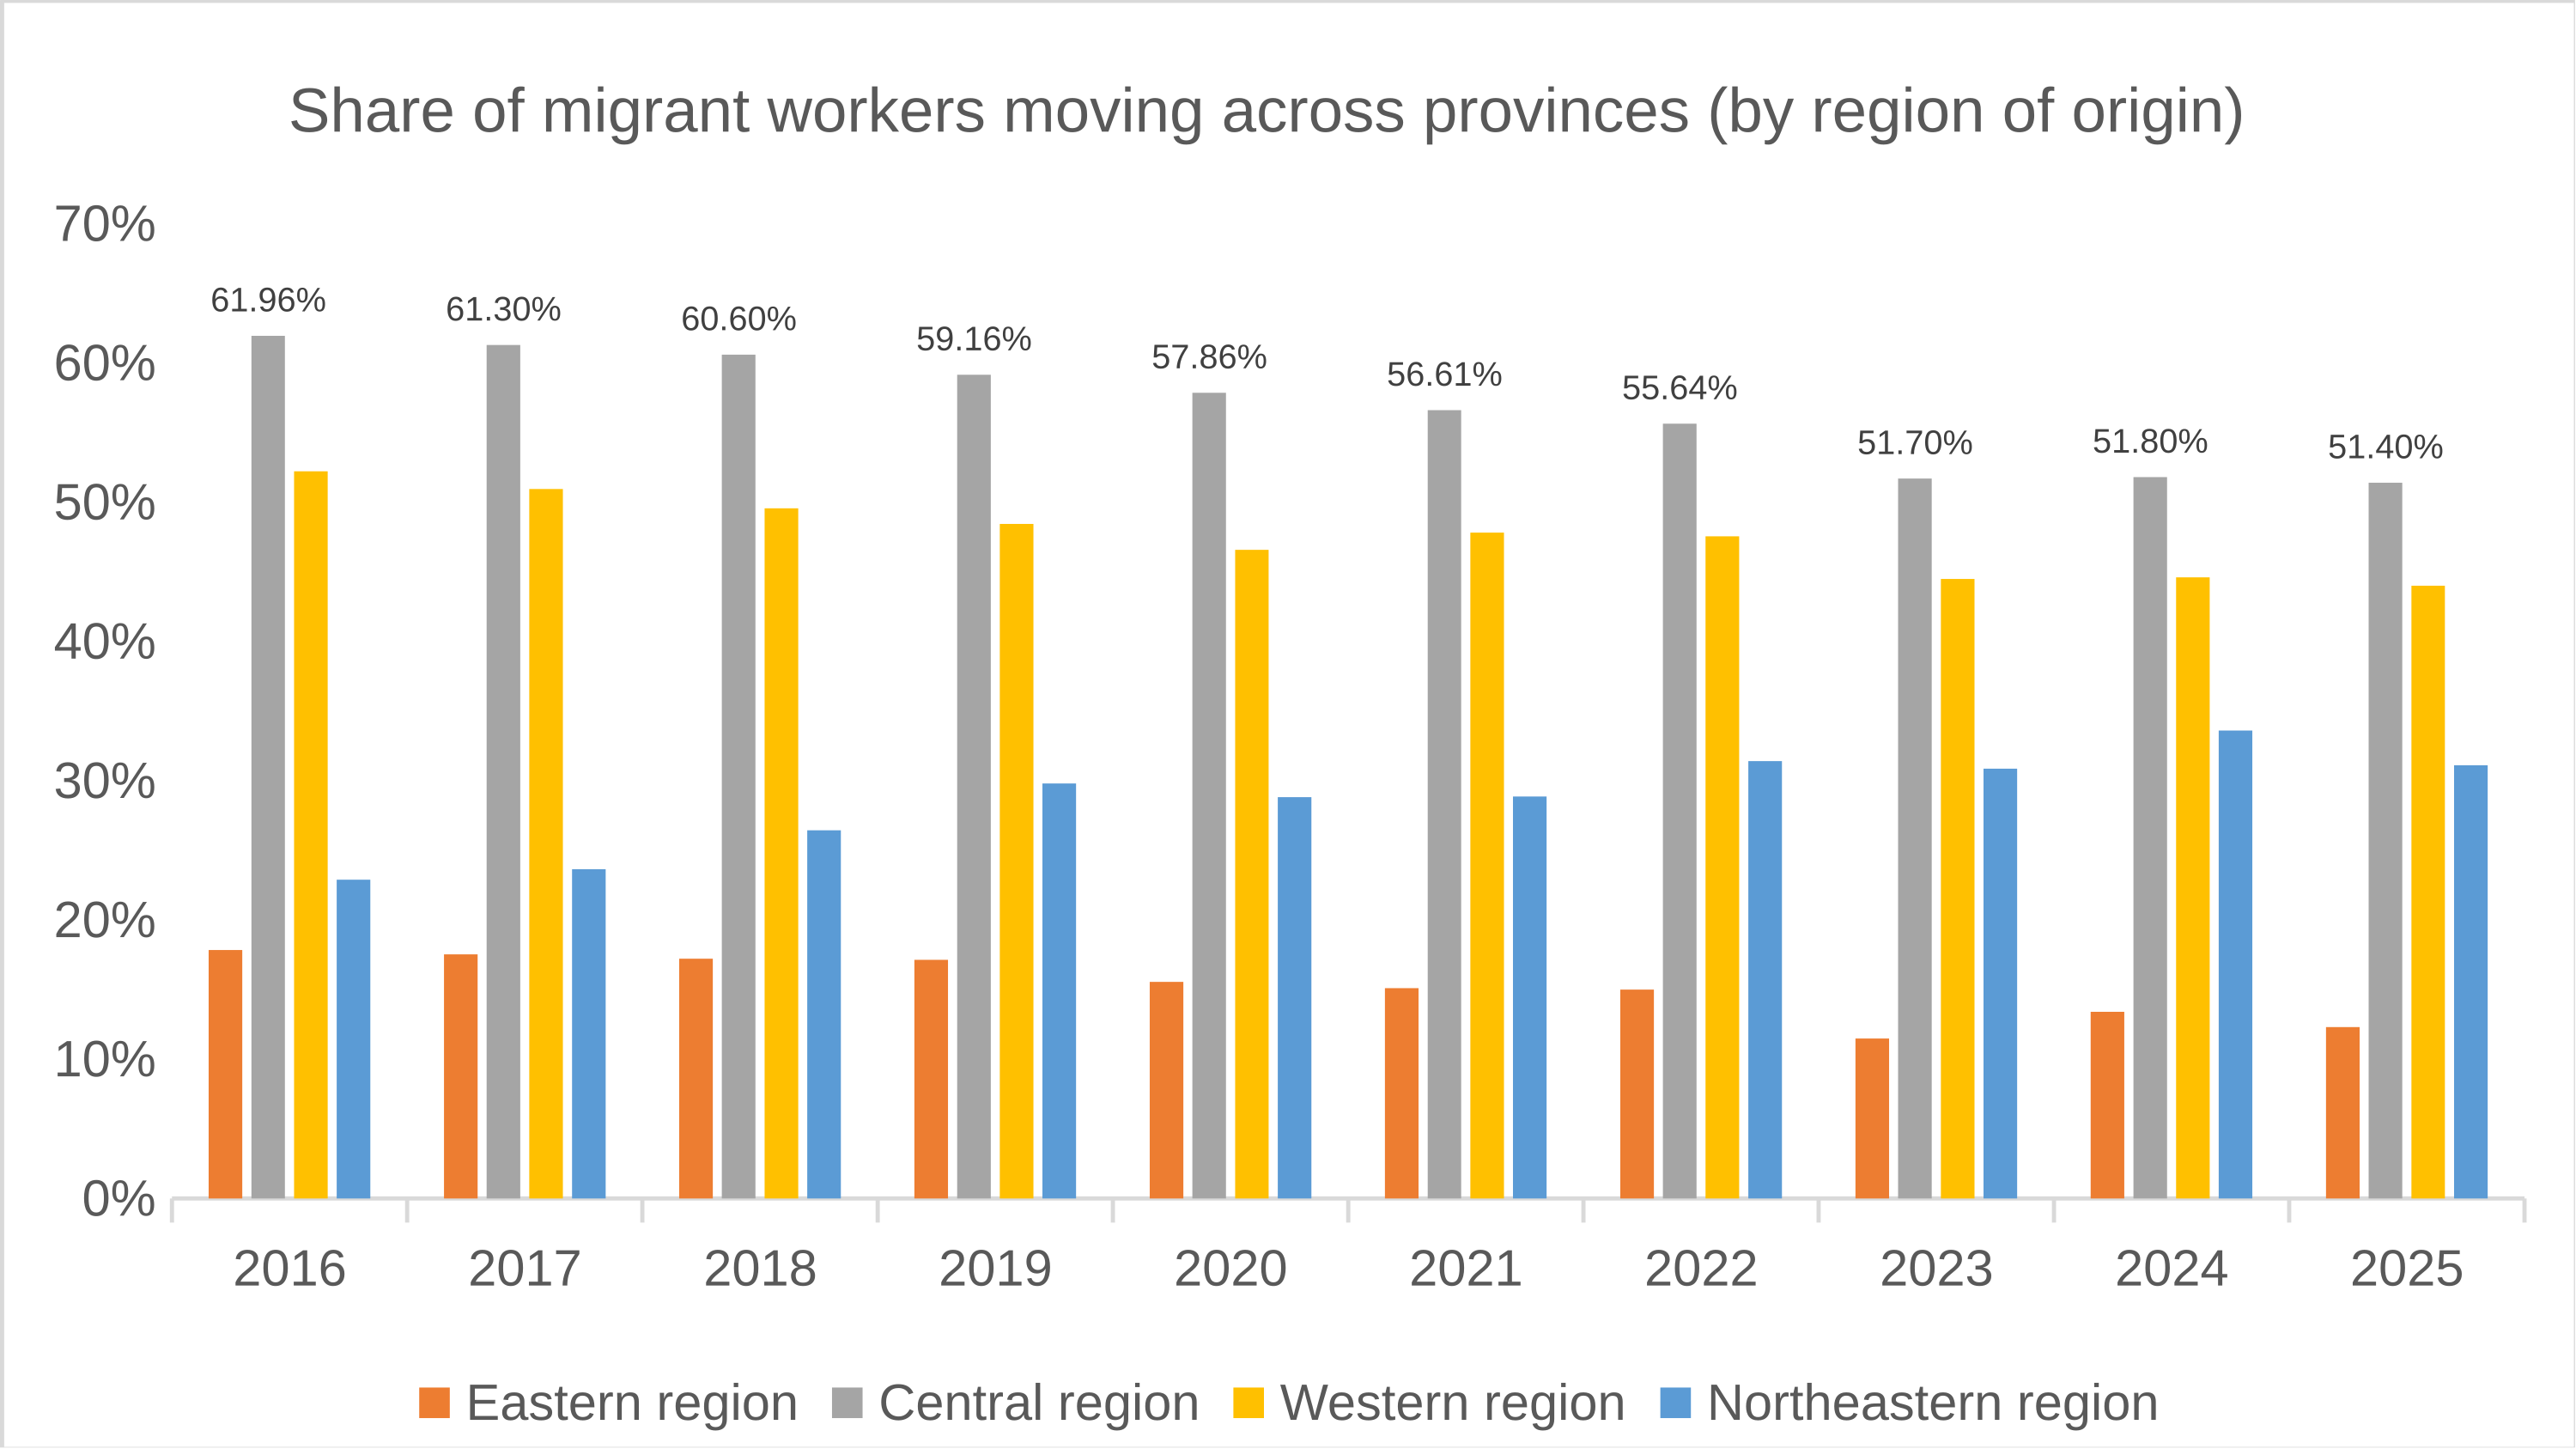
The slowdown in the growth of the migrant-worker population has been accompanied by a steady decline in the share moving across provincial boundaries. Many rural workers now prefer jobs in nearby counties or cities rather than long-distance employment in another province. Large-scale interregional migration is contracting. In 2025, 67.65 million migrant workers moved across provincial boundaries, 750,000 fewer than the year before, a decline of 1.1 per cent. By contrast, 112.41 million moved within their home provinces, an increase of 2.1 million, or 1.9 per cent. Interprovincial migrants accounted for 37.6 per cent of migrant workers employed away from their local townships, down 0.7 percentage points from the previous year.
Even in Central China, the region with the highest proportion of interprovincial migrant workers, the share has fallen to 51.4 per cent and is declining. In 2025, migrant workers had an average age of 43.3, and 32 per cent were aged 50 or above. As more workers grow older, leave migrant employment, and return home, labour mobility will weaken further.
Figure 13. Share of Migrant Workers Moving across Provinces by Region, 2016–2025
Metropolitan Concentration Continues
Strong Provinces, Metropolitan Regions, and Manufacturing Hubs Continue to Attract Migrants
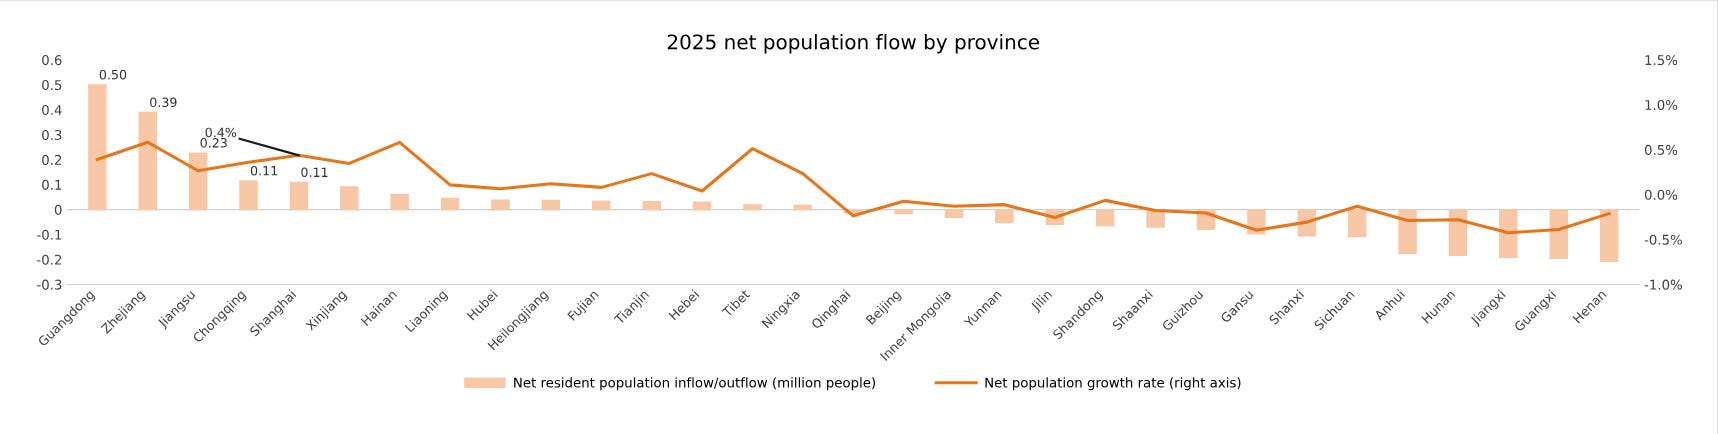
Rural China is older than urban China, and the pool of surplus rural labour available for migration is nearing exhaustion. Population growth in large cities will therefore depend increasingly on redistribution within the urban system and on the continued concentration of people in major metropolitan regions. Excluding natural population growth, net population inflows are increasingly concentrated in Guangdong, Zhejiang, and Jiangsu.
In 2025, Guangdong recorded a net population inflow of 500,000 (excluding natural population change), overtaking Zhejiang’s 389,000 and Jiangsu’s 227,000 to regain first place nationwide. Chongqing returned to positive net migration, ranking fourth with an inflow of 115,000. Sichuan and Anhui, both of which had recorded large net inflows in 2023 and 2024, shifted back to net outflows in 2025.
Figure 14. Net Population Inflows and Outflows by Province in 2025
Zhejiang Has Become China’s Most Dynamic Province
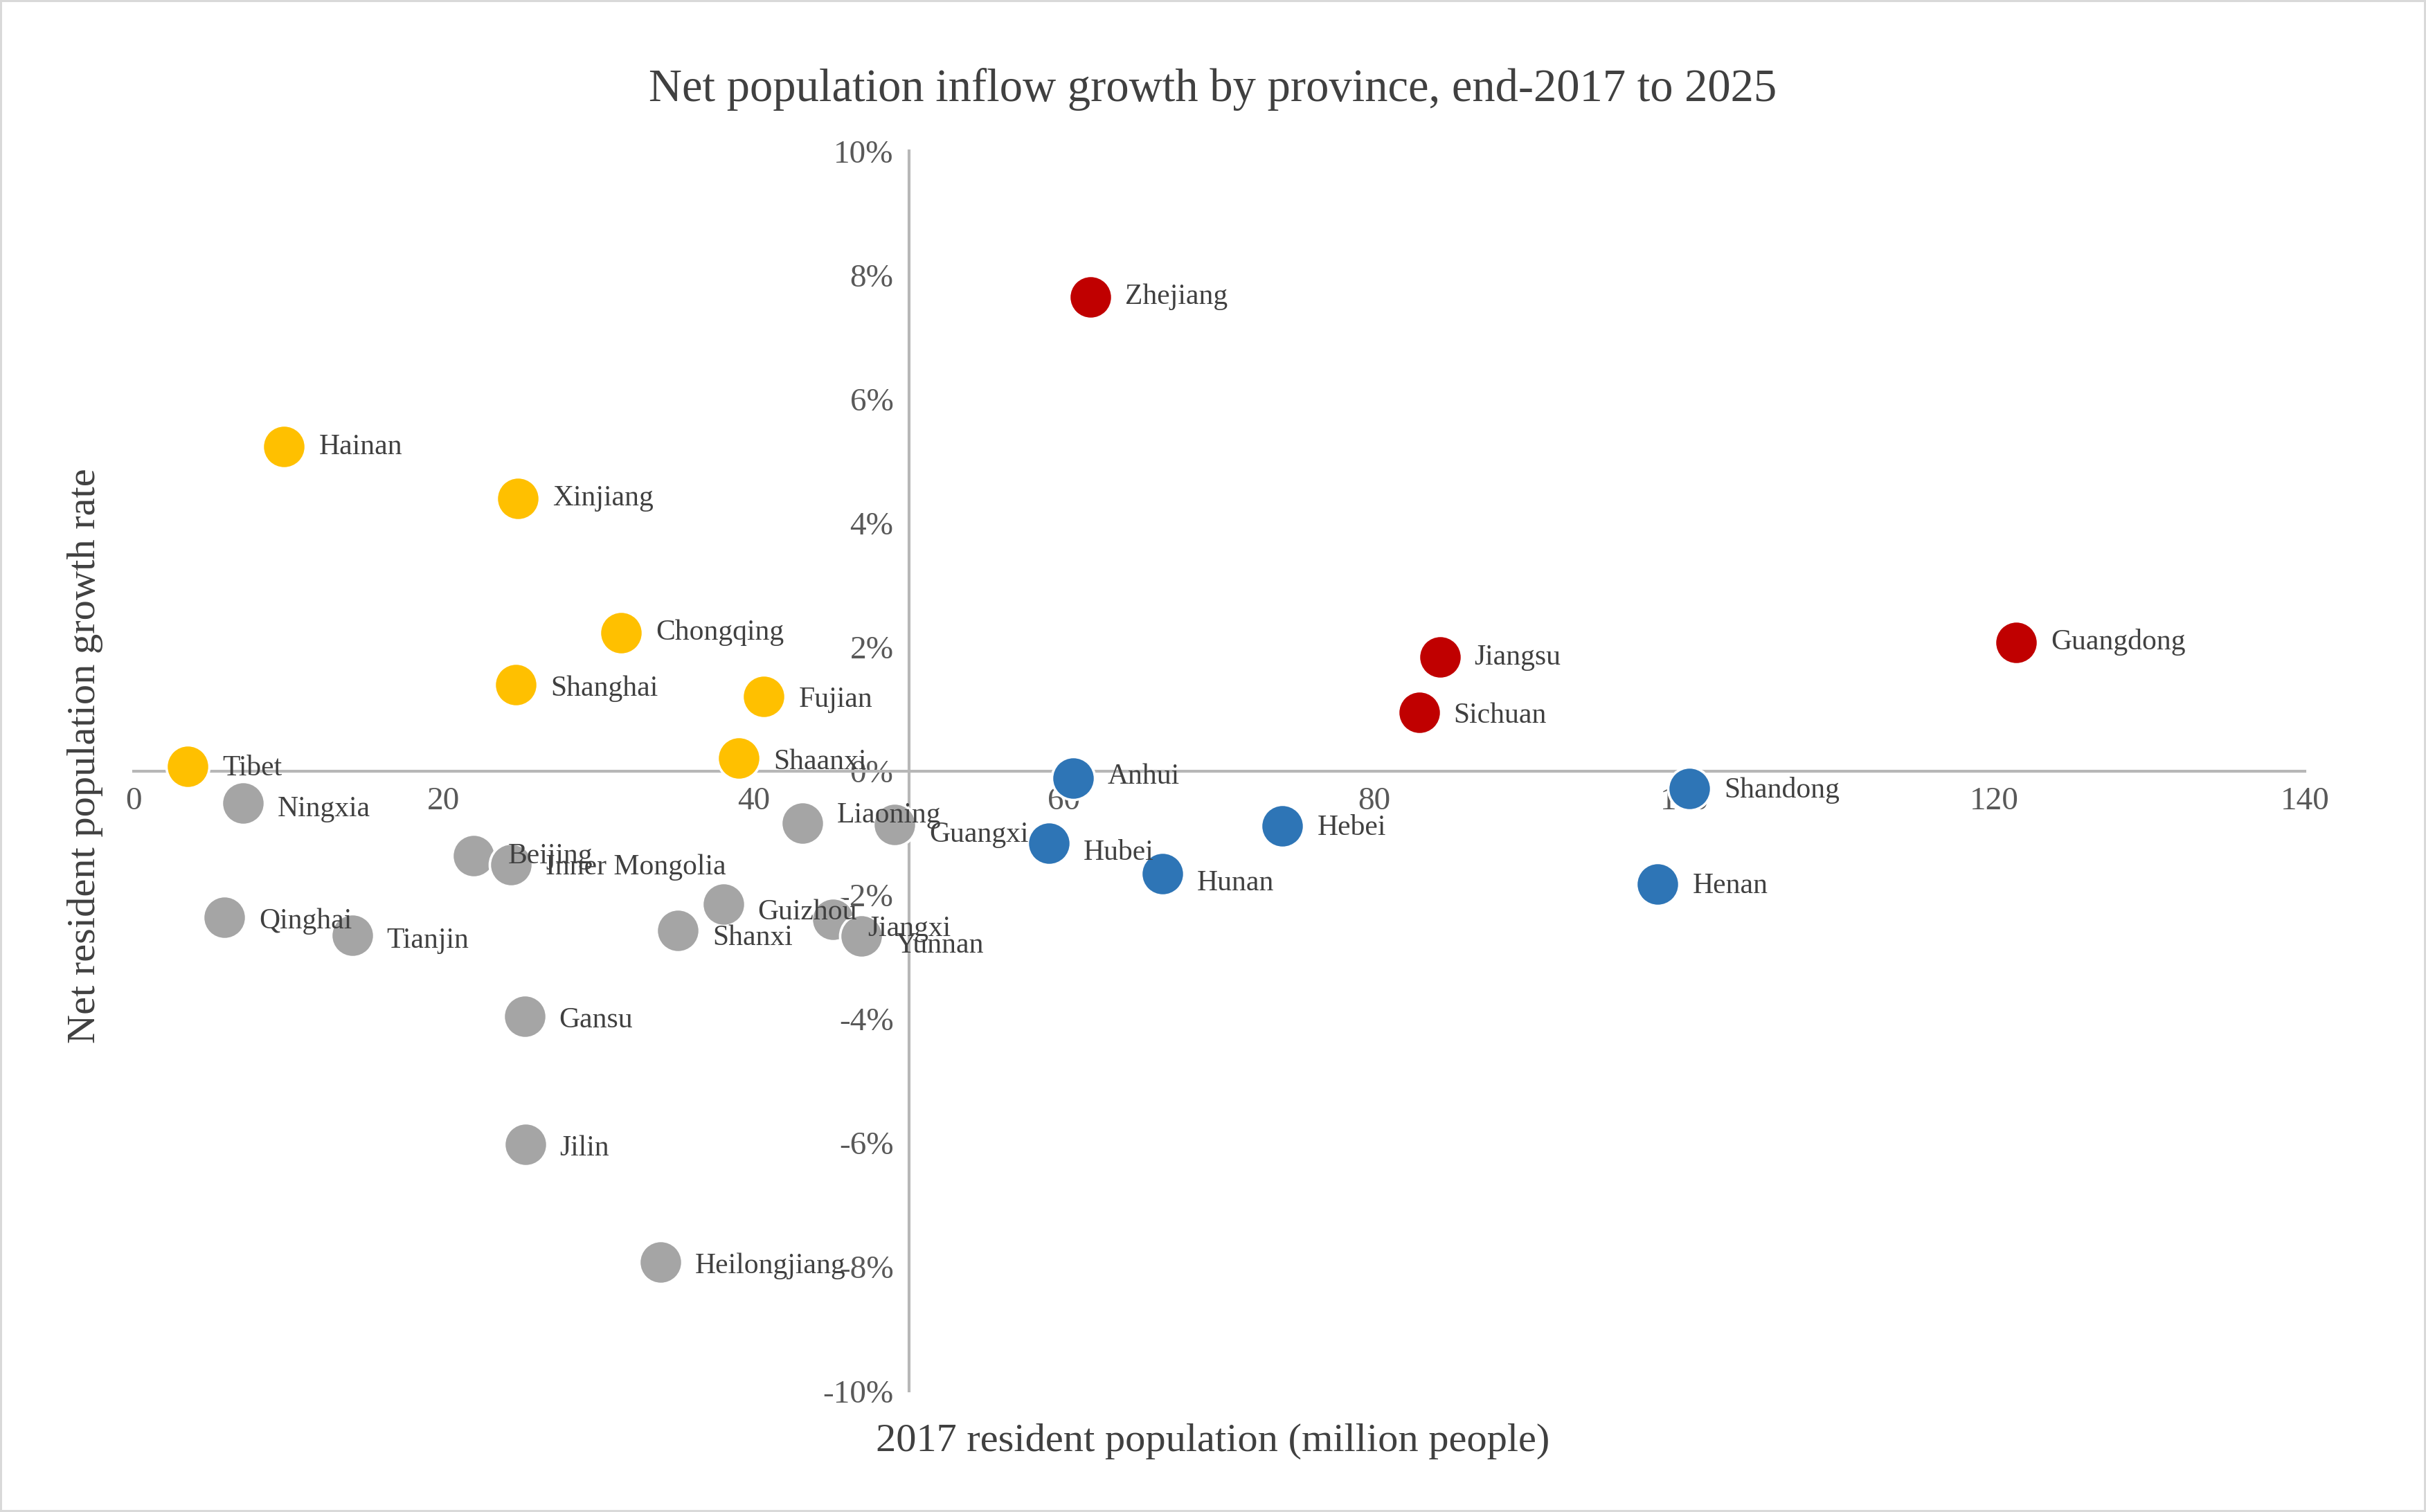
Over the longer term, China’s population has continued to concentrate along the Yangtze River, along the coast, and in major inland city clusters. The Yangtze River Delta, Pearl River Delta, and Chengdu–Chongqing region have recorded some of the largest net inflows. Zhejiang already has a large population, yet after natural population change is excluded, net migration increased its resident population by 7.6 per cent over the past eight years — far faster than in any other province.
Guangdong, Jiangsu, and Sichuan also recorded net gains of around 1–2 per cent over the same period upon their already large populations, reinforcing the nationwide concentration of people in economically dynamic core regions. Hainan, Xinjiang, Chongqing, Shanghai, Fujian, Shaanxi, and Tibet, though smaller in population, also maintained net inflows over the past eight years. In contrast, the six populous provinces of Henan, Hunan, Hubei, Hebei, Shandong, and Anhui all experienced net outflows.
Figure 15. Growth in Net Population Inflows by Province, End-2017 to 2025
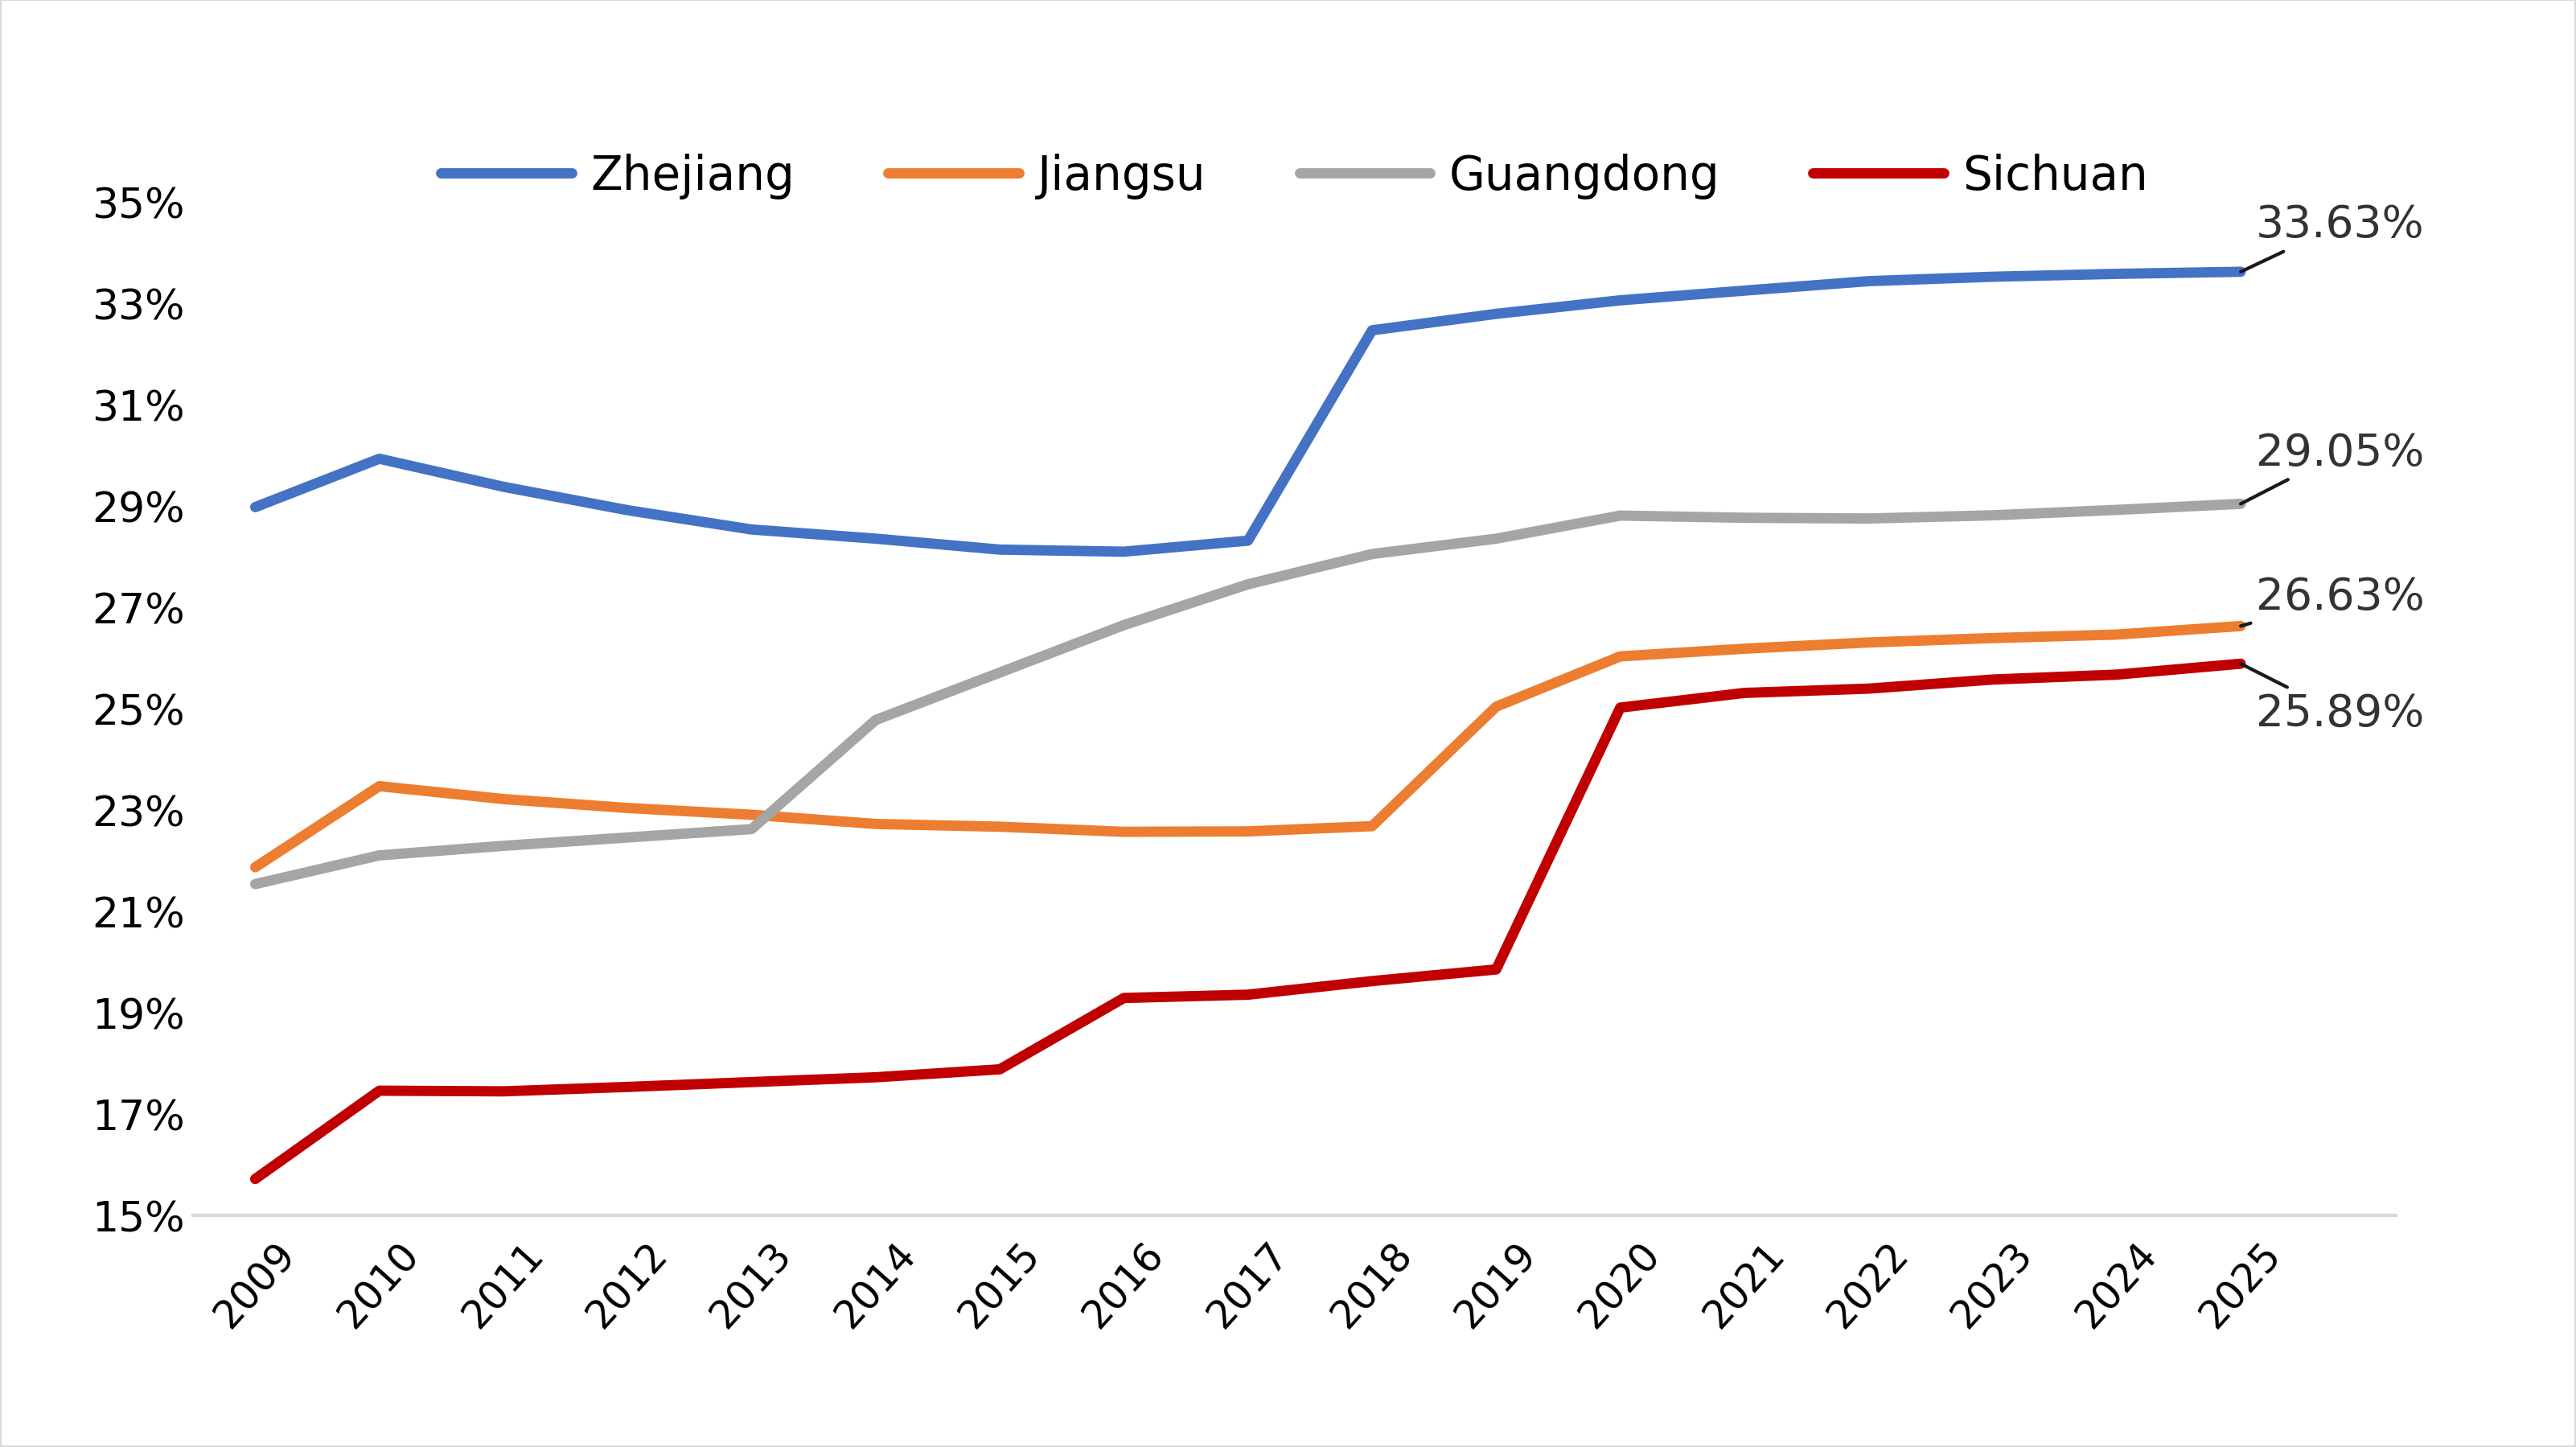
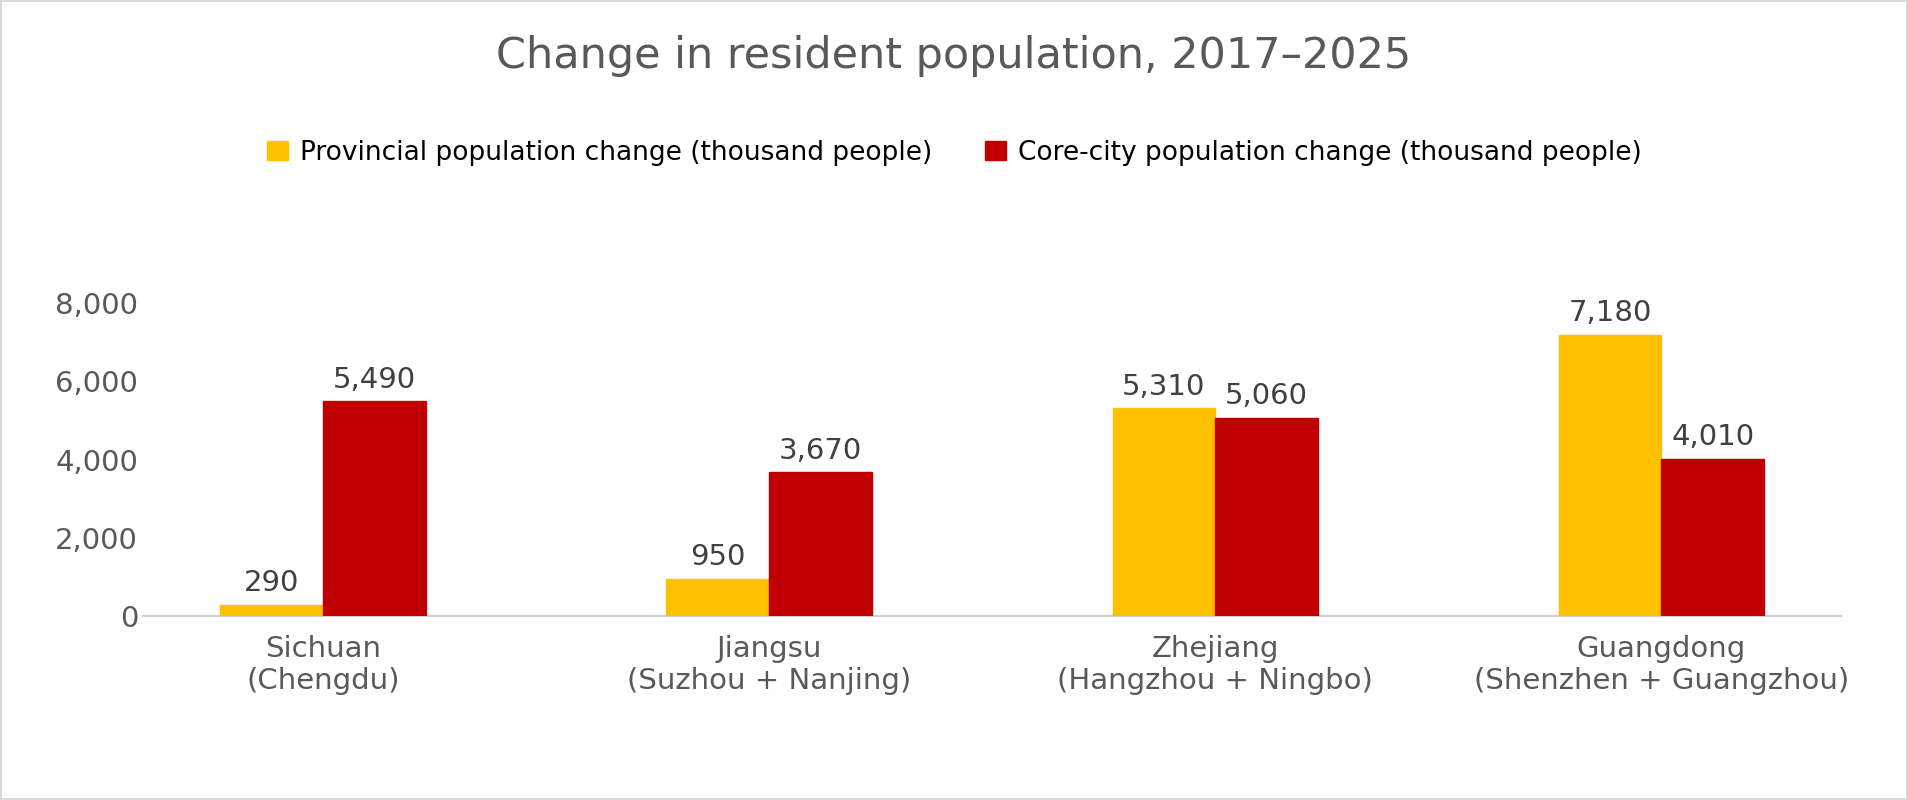
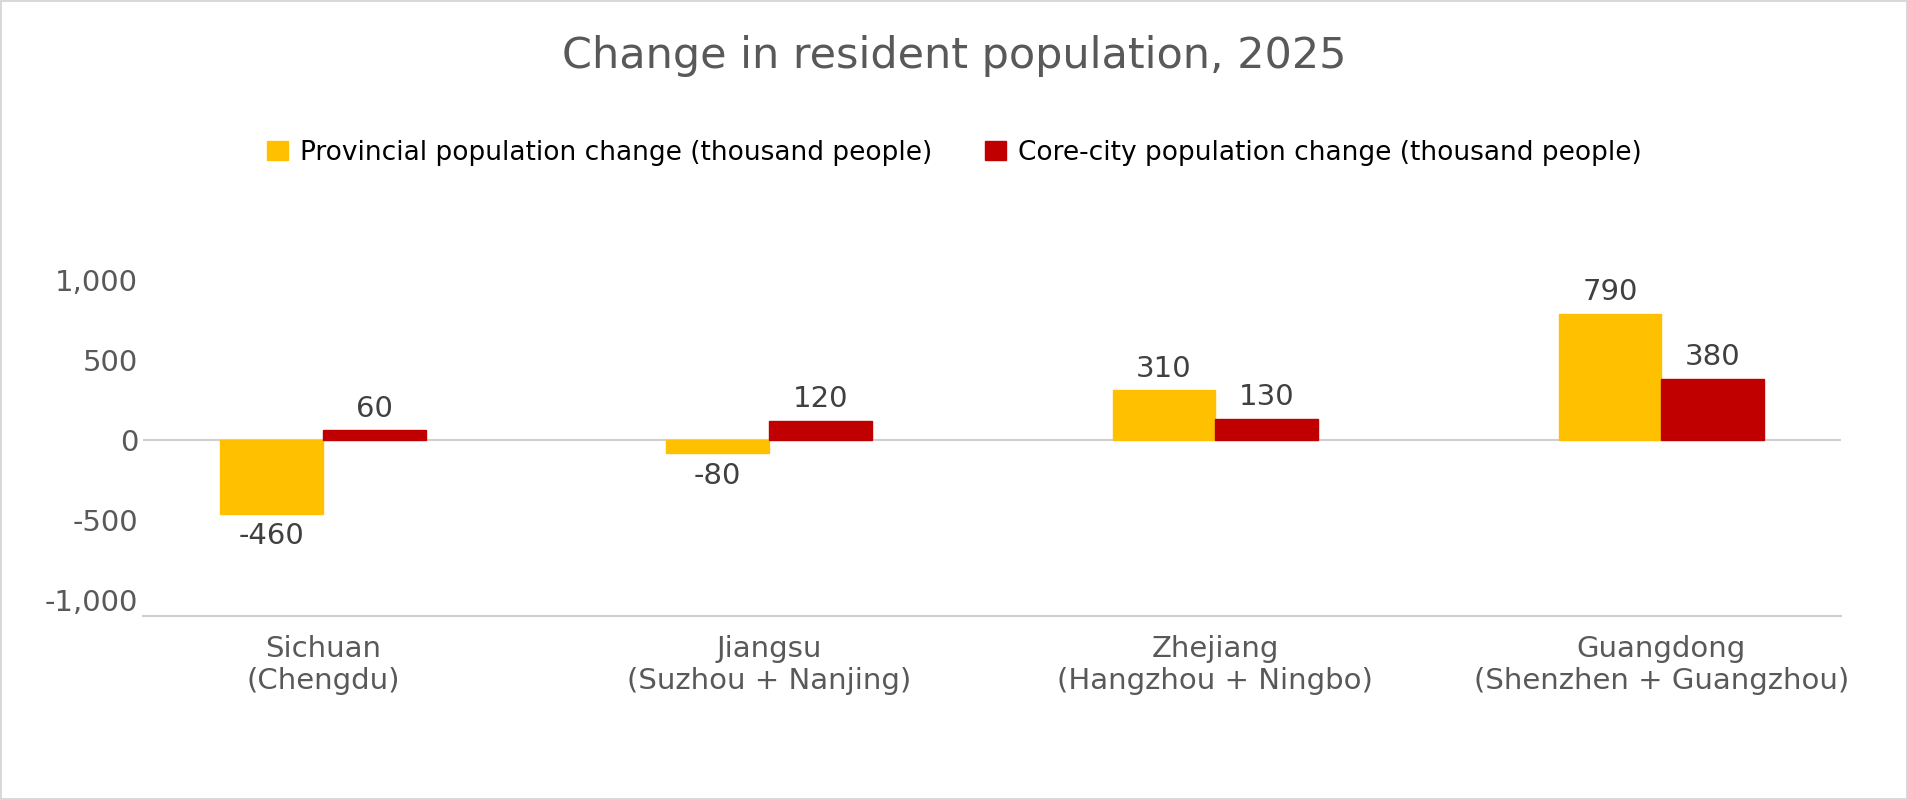
Within major metropolitan regions, people are concentrating further in the core cities. By 2025, Hangzhou and Ningbo in Zhejiang, Suzhou and Nanjing in Jiangsu, Shenzhen and Guangzhou in Guangdong, and Chengdu in Sichuan together accounted for around 30 per cent of their respective provincial populations. Changes in resident population show that these core cities contributed most of the population growth in their regions.
Between 2017 and 2025, Guangzhou and Shenzhen accounted for more than half of Guangdong’s total population increase. Hangzhou and Ningbo contributed more than 95 per cent of Zhejiang’s. The population gains in Suzhou and Nanjing, and in Chengdu, were larger than the net increases recorded by Jiangsu and Sichuan as a whole. Even in 2025, when the resident populations of both Jiangsu and Sichuan declined overall, Suzhou, Nanjing, and Chengdu continued to grow. Population concentration within metropolitan regions is therefore likely to intensify. (Because city-level birth and death data are incomplete, these urban population figures have not been adjusted for natural population change.)
Figures 16–18. Population Concentration Continues to Increase in Major Metropolitan Areas
Within Provinces, Urban Growth Is Increasingly Concentrated in Provincial Capitals
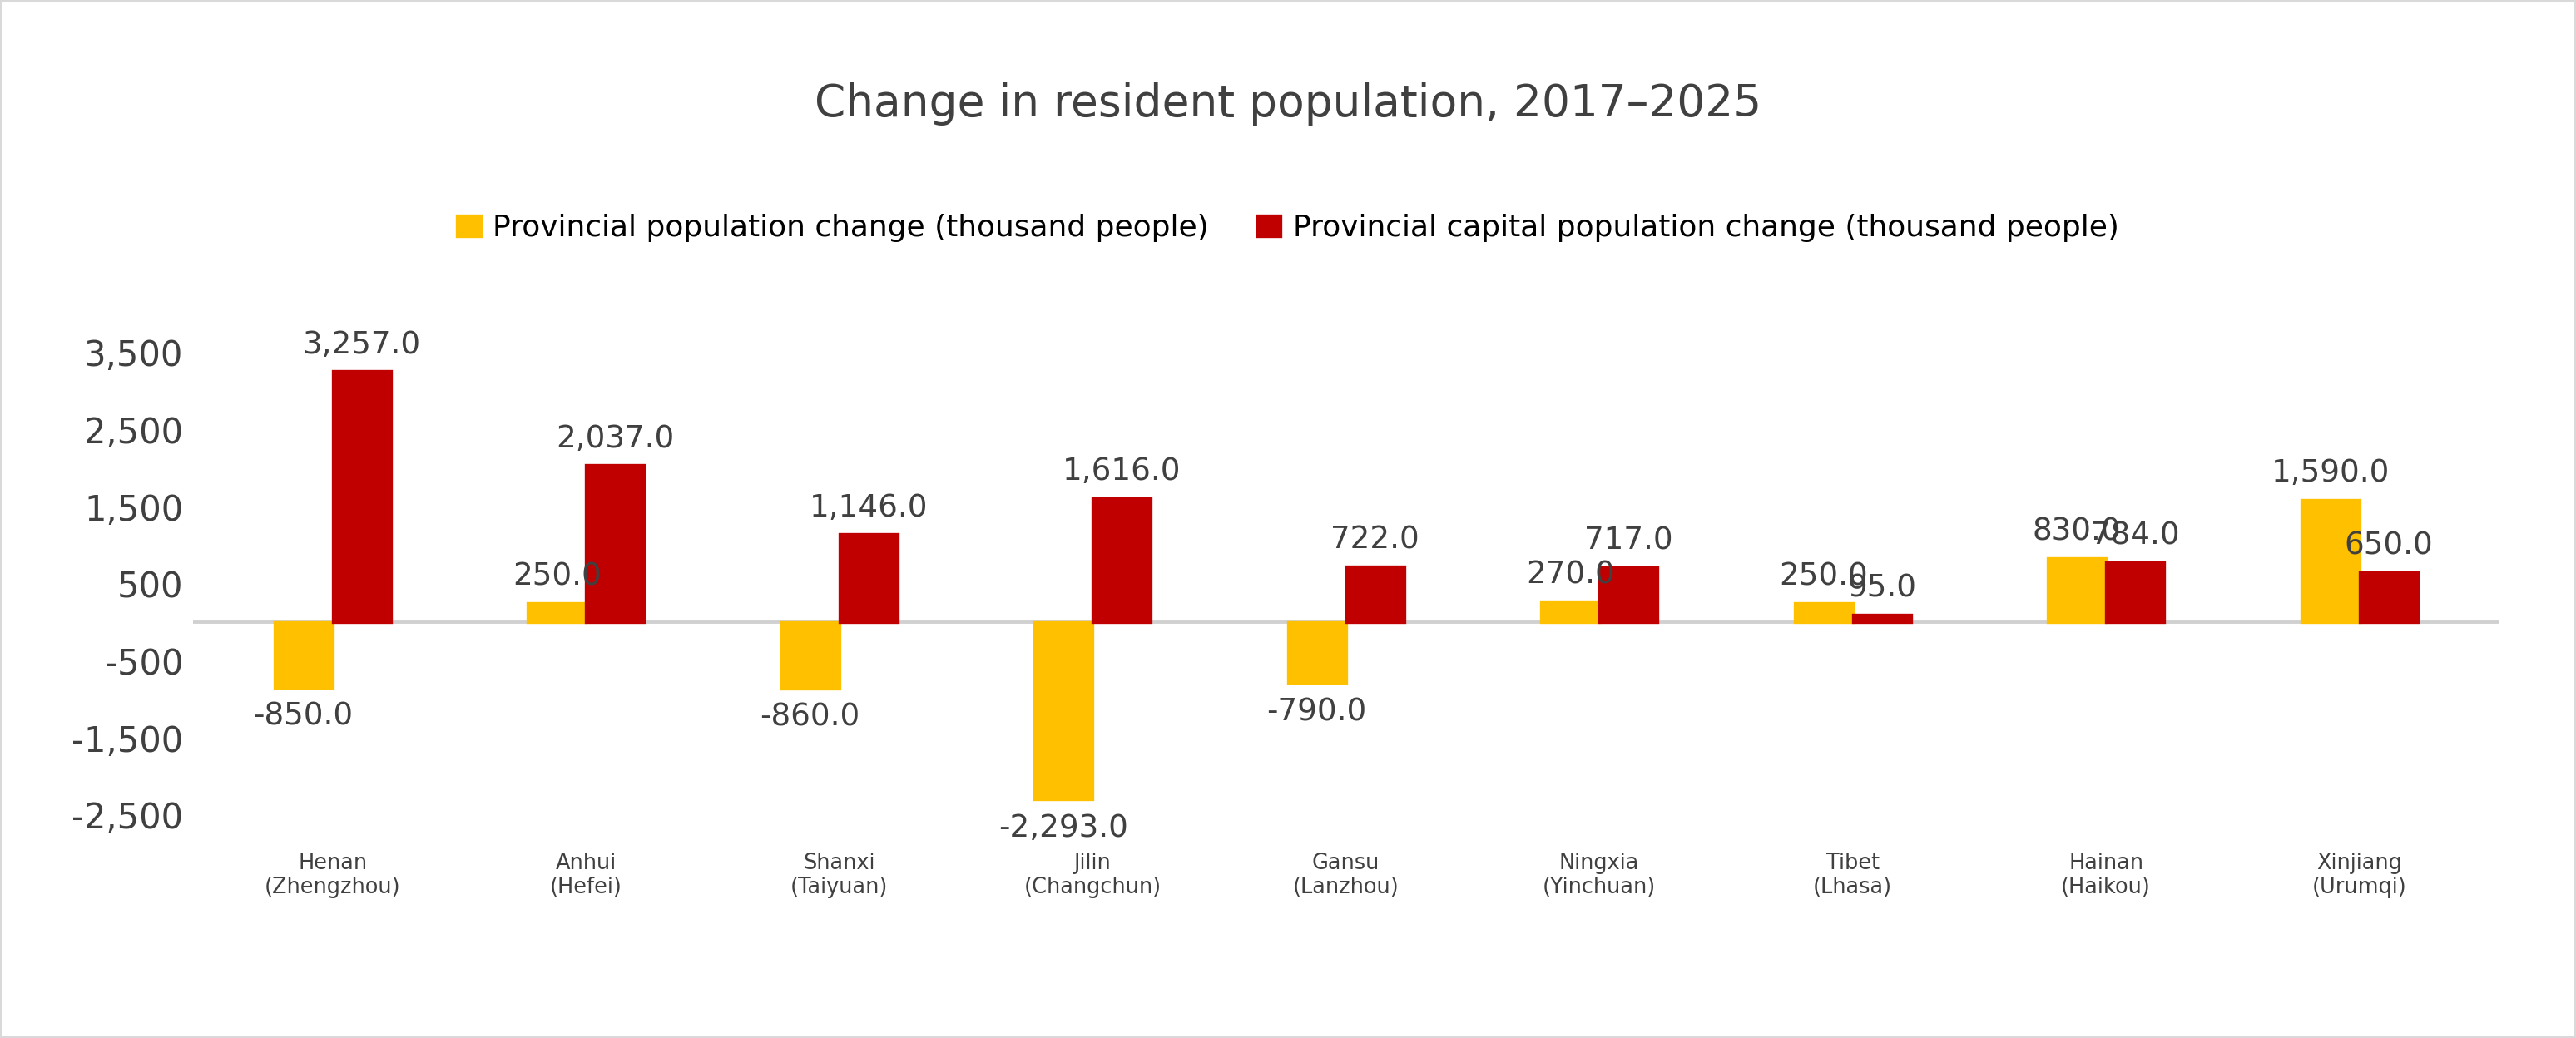
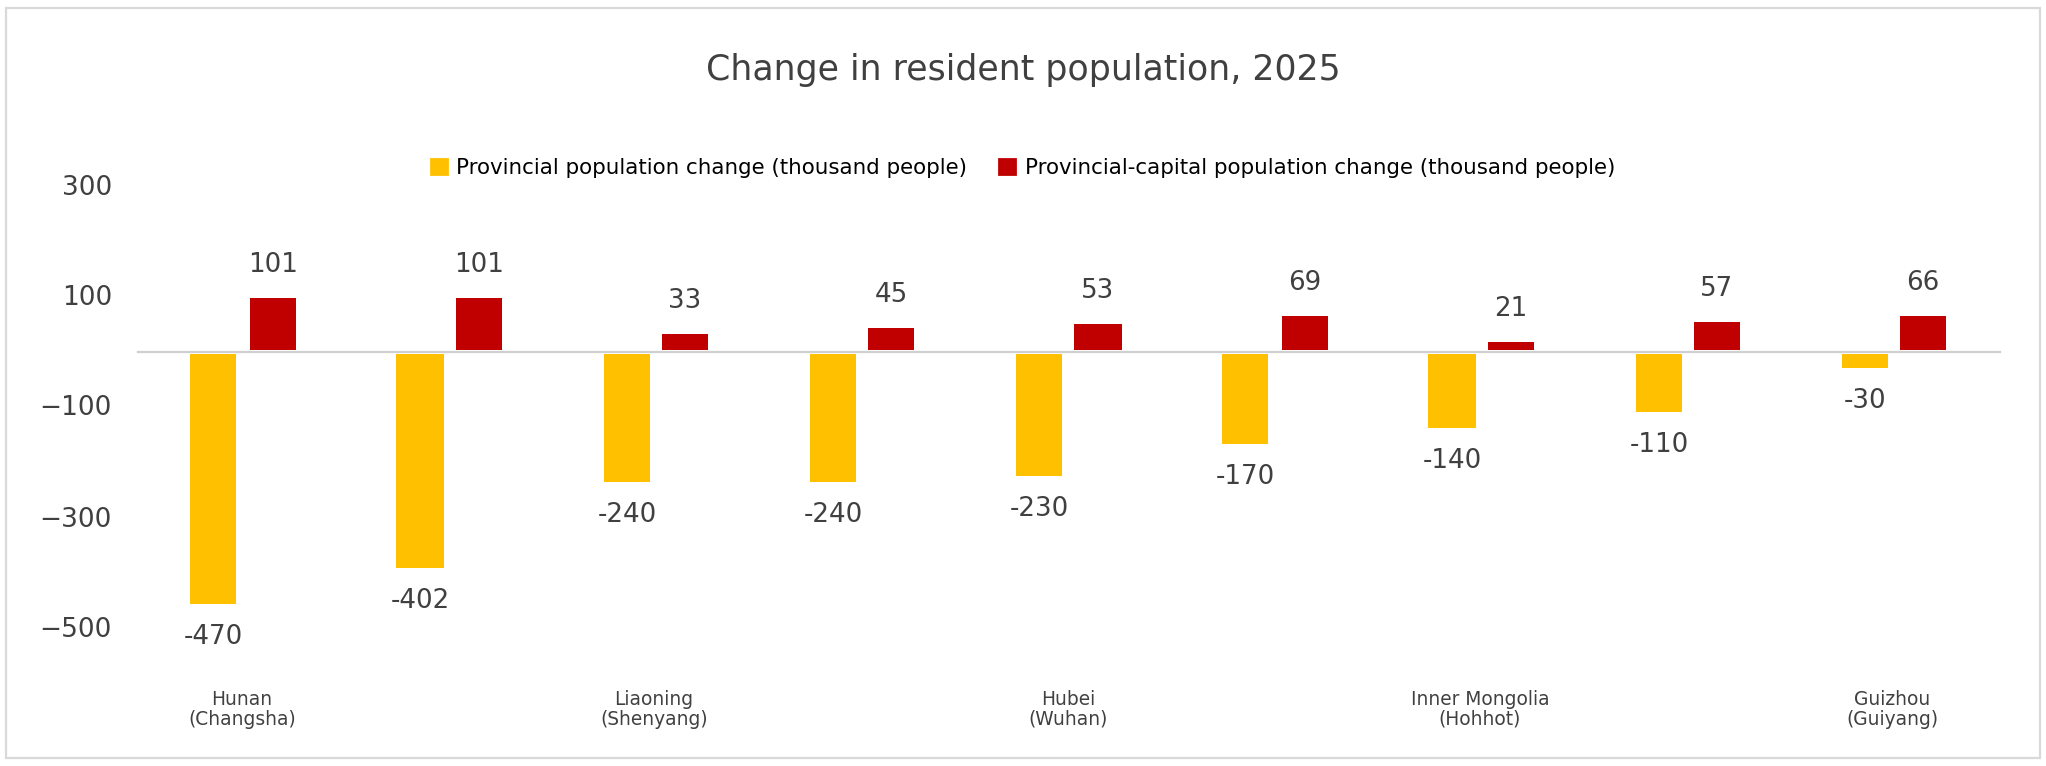
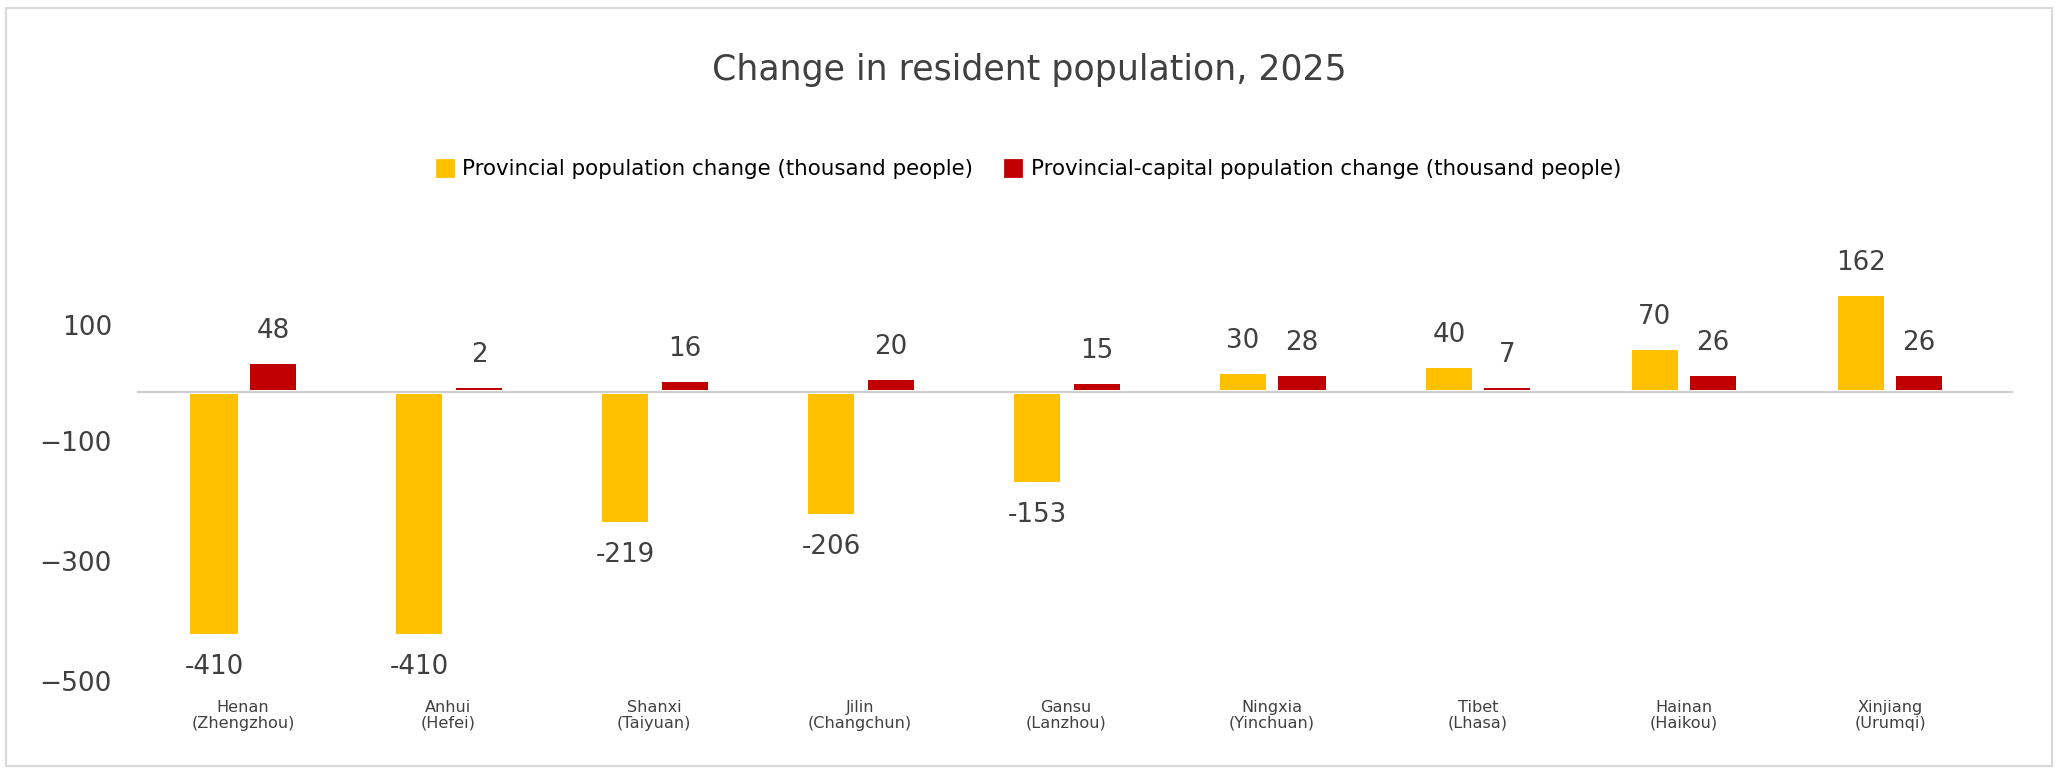
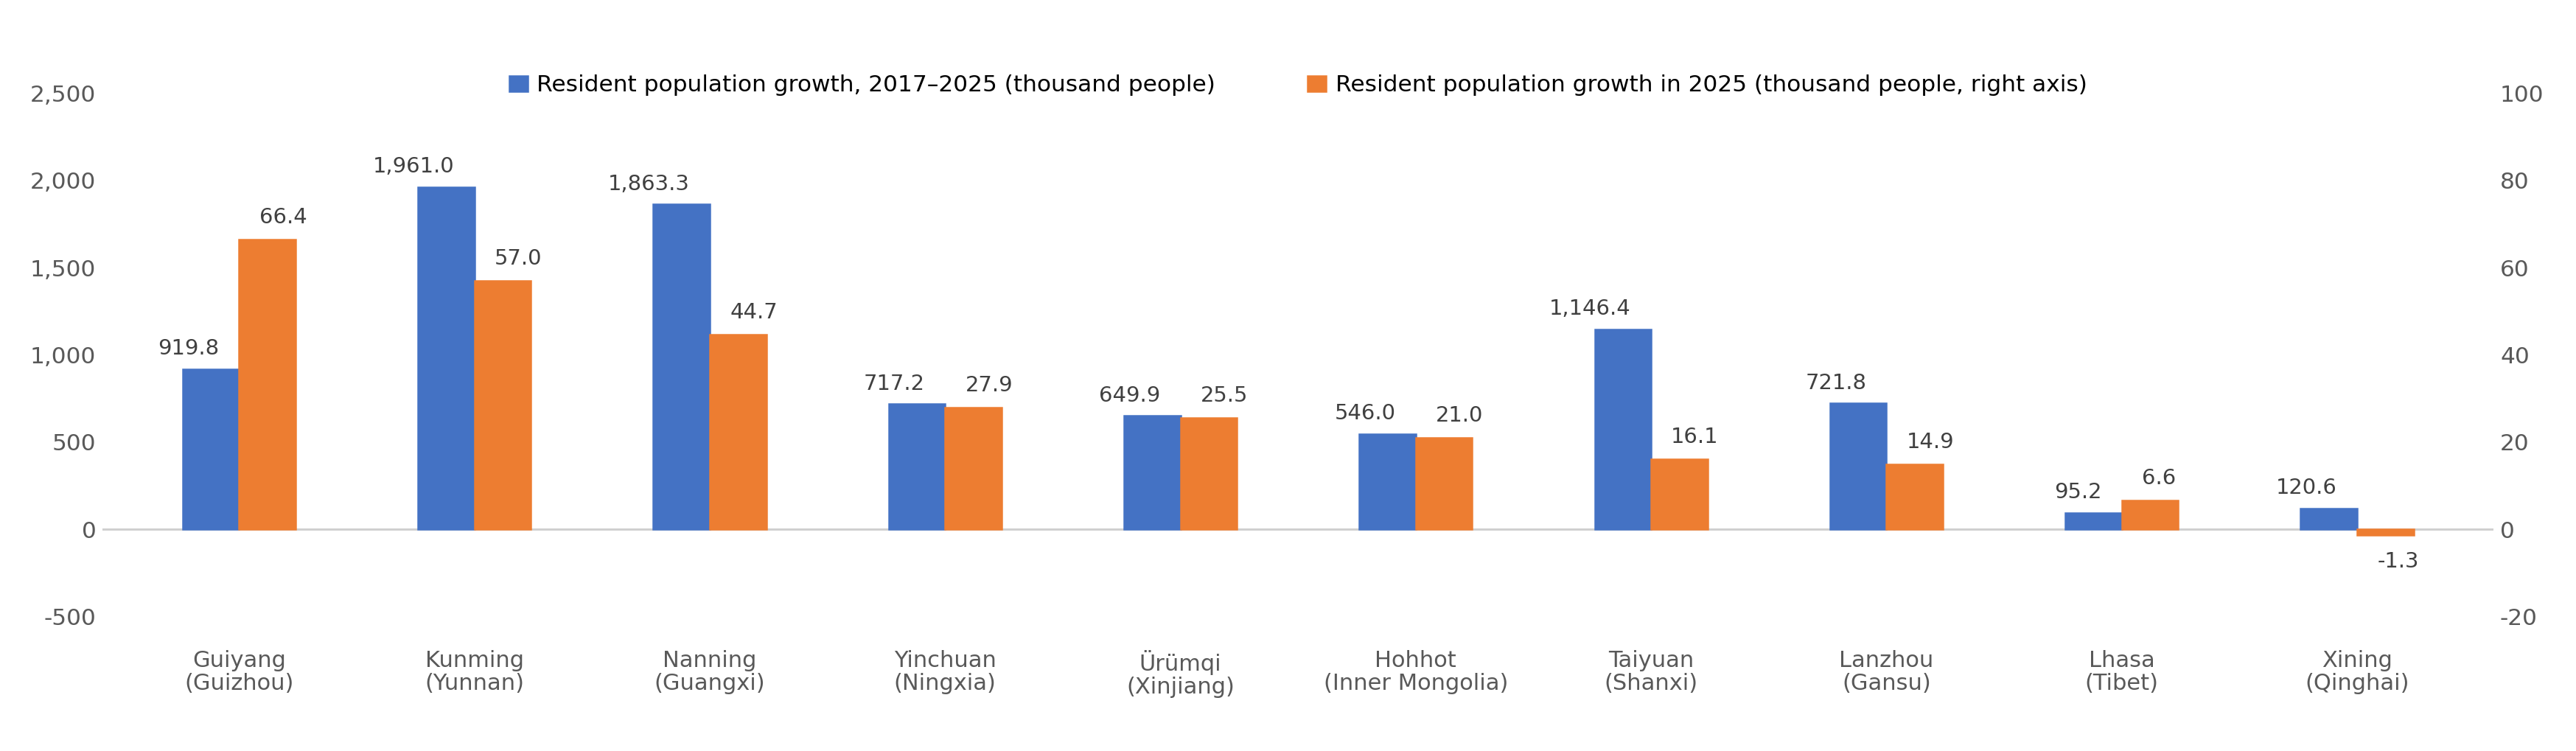
Even in provinces with weaker economies or smaller populations, almost every provincial capital continued to expand. In 2025, all provincial capitals gained population except Shijiazhuang of Hebei and Xining of Qinghai, whose populations fell by just 300 and 1,300 respectively; Nanchang of Jiangxi had not yet released updated data. Harbin of Heilongjiang lost a cumulative 1.042 million residents between 2017 and 2025 as a result of ageing and regional outmigration. Yet in 2024 and 2025 it added 110,000 residents, helped by temporary labour demand generated by its winter-tourism boom and by modest inflows from surrounding parts of Heilongjiang.
Over a longer period, provincial capitals have been the principal source of population growth within their provinces. Several provincial capitals in Northeast, Central, and Western China gained residents over the past eight years even as their provinces continued to lose population. These capitals are clearly drawing people away from surrounding cities. (Because city-level birth and death data are incomplete, the figures have not been adjusted for natural population change.)
Figures 19–20. Less Developed Provinces: Cumulative Population Change in Provincial Capitals Compared with Provincial Totals, 2017–2025
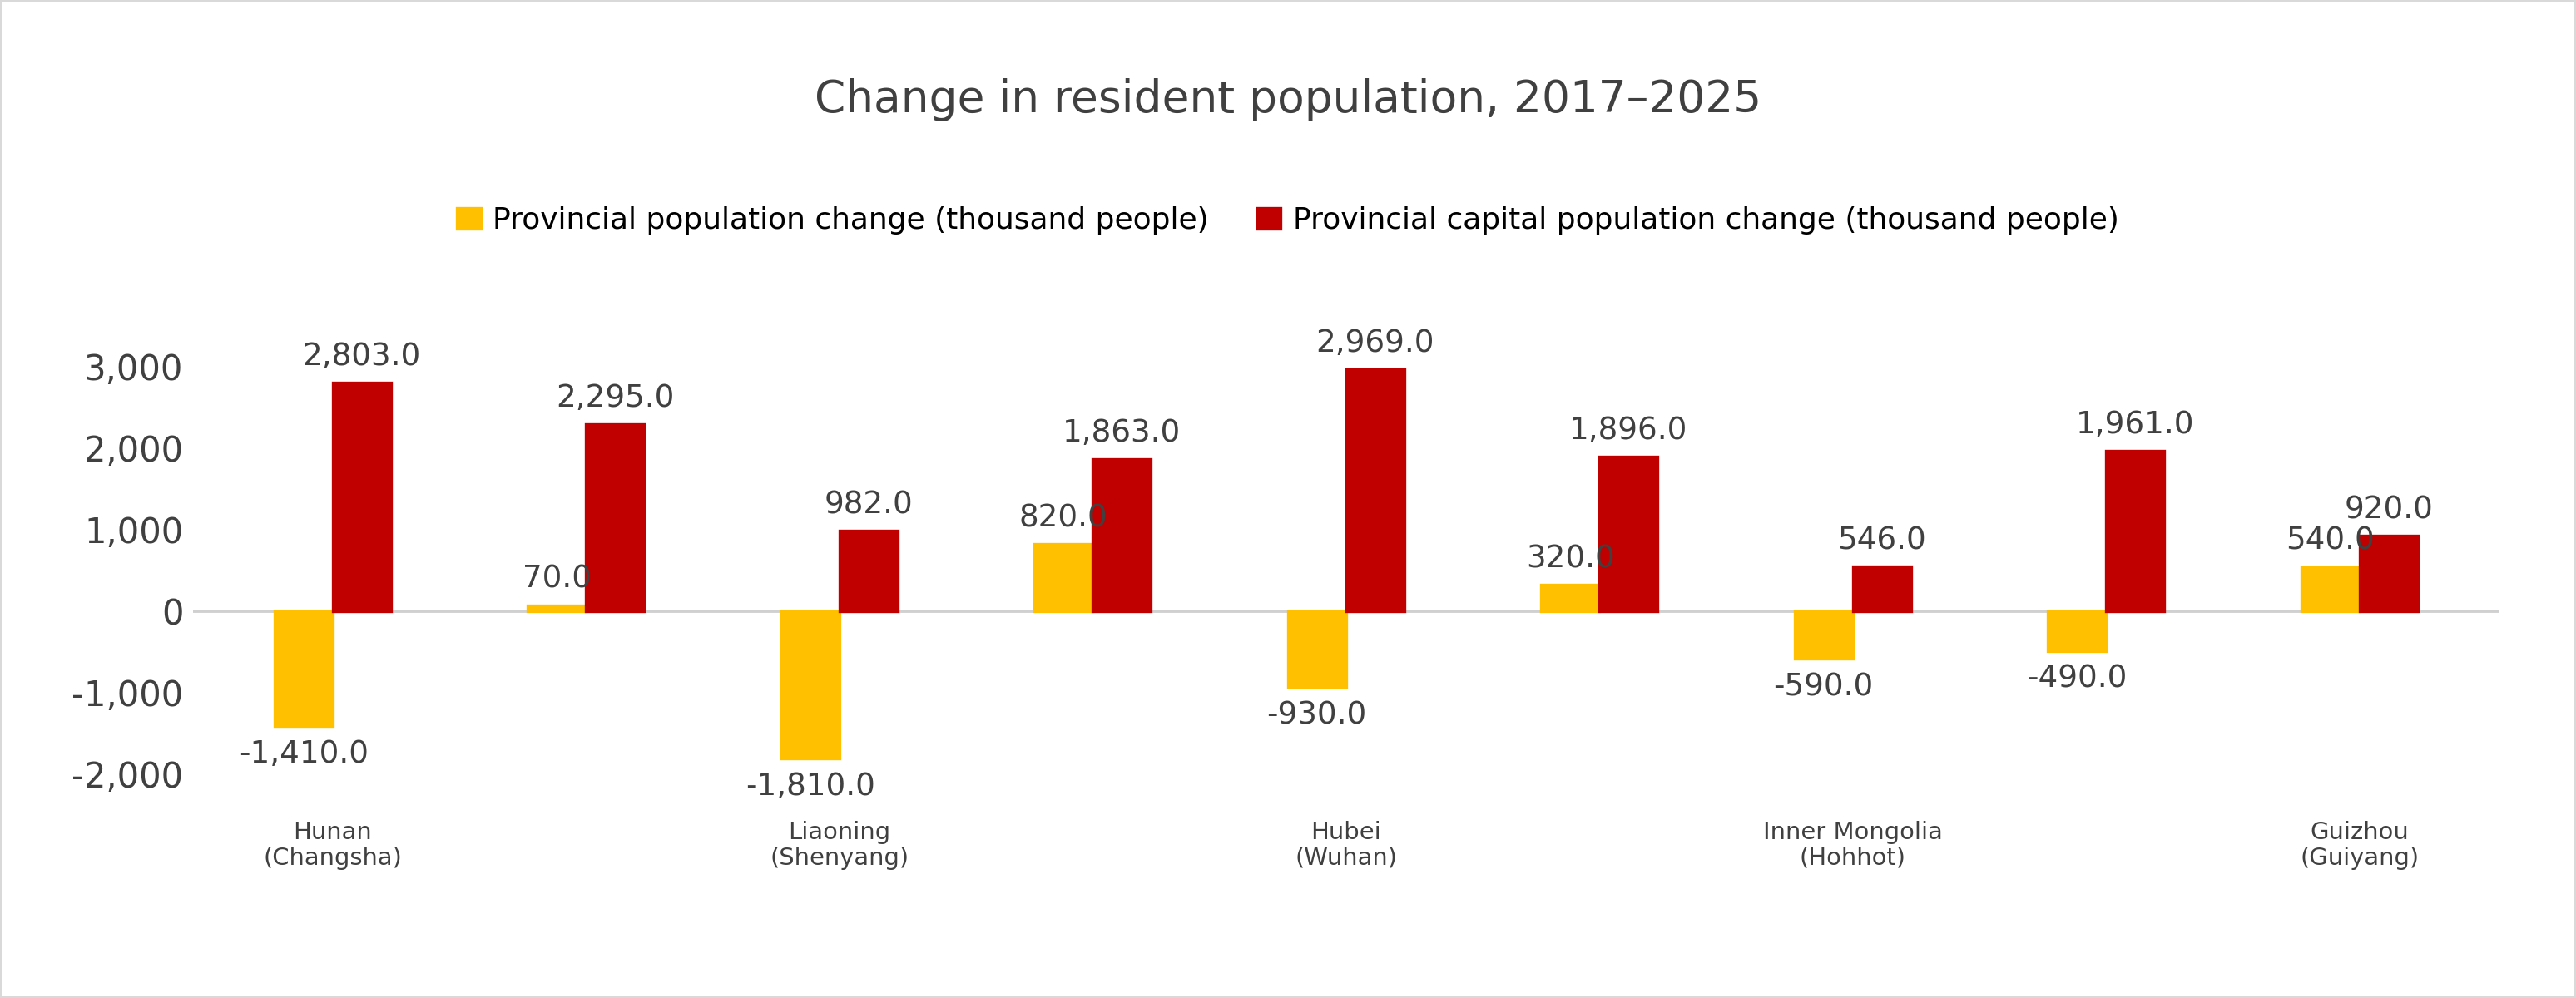
Figures 21–22. Less Developed Provinces: Population Change in Provincial Capitals Compared with Provincial Totals, 2025
China May Be Entering a Phase of “Passive Urbanisation”
“Passive urbanisation” refers to a stage in which the urbanisation rate no longer rises mainly because rural residents are moving into cities. During a prolonged period of total population decline, the urban share may increase because the rural population is shrinking naturally faster than the urban population, and because of administrative boundary changes.
Japan offers a useful example. Between 2000 and 2010, much of the increase in its urbanisation rate resulted from municipal boundary changes and the deaths of older residents in towns and villages, rather than from large inflows into cities (Qin Hong and Wang Yanfei, 2024). Population growth became concentrated in Tokyo and Osaka, helping property prices in those two metropolitan areas remain relatively firm after 2010, while housing markets in most other cities remained weak. This helps explain why Japan’s urbanisation rate rose from 77 per cent when its property bubble burst in 1991 to about 90 per cent in 2010 even as nationwide housing prices continued to fall. Passive urbanisation did not create substantial new demand for urban housing.
Figure 23. Urbanisation Rates in China and Japan (%)
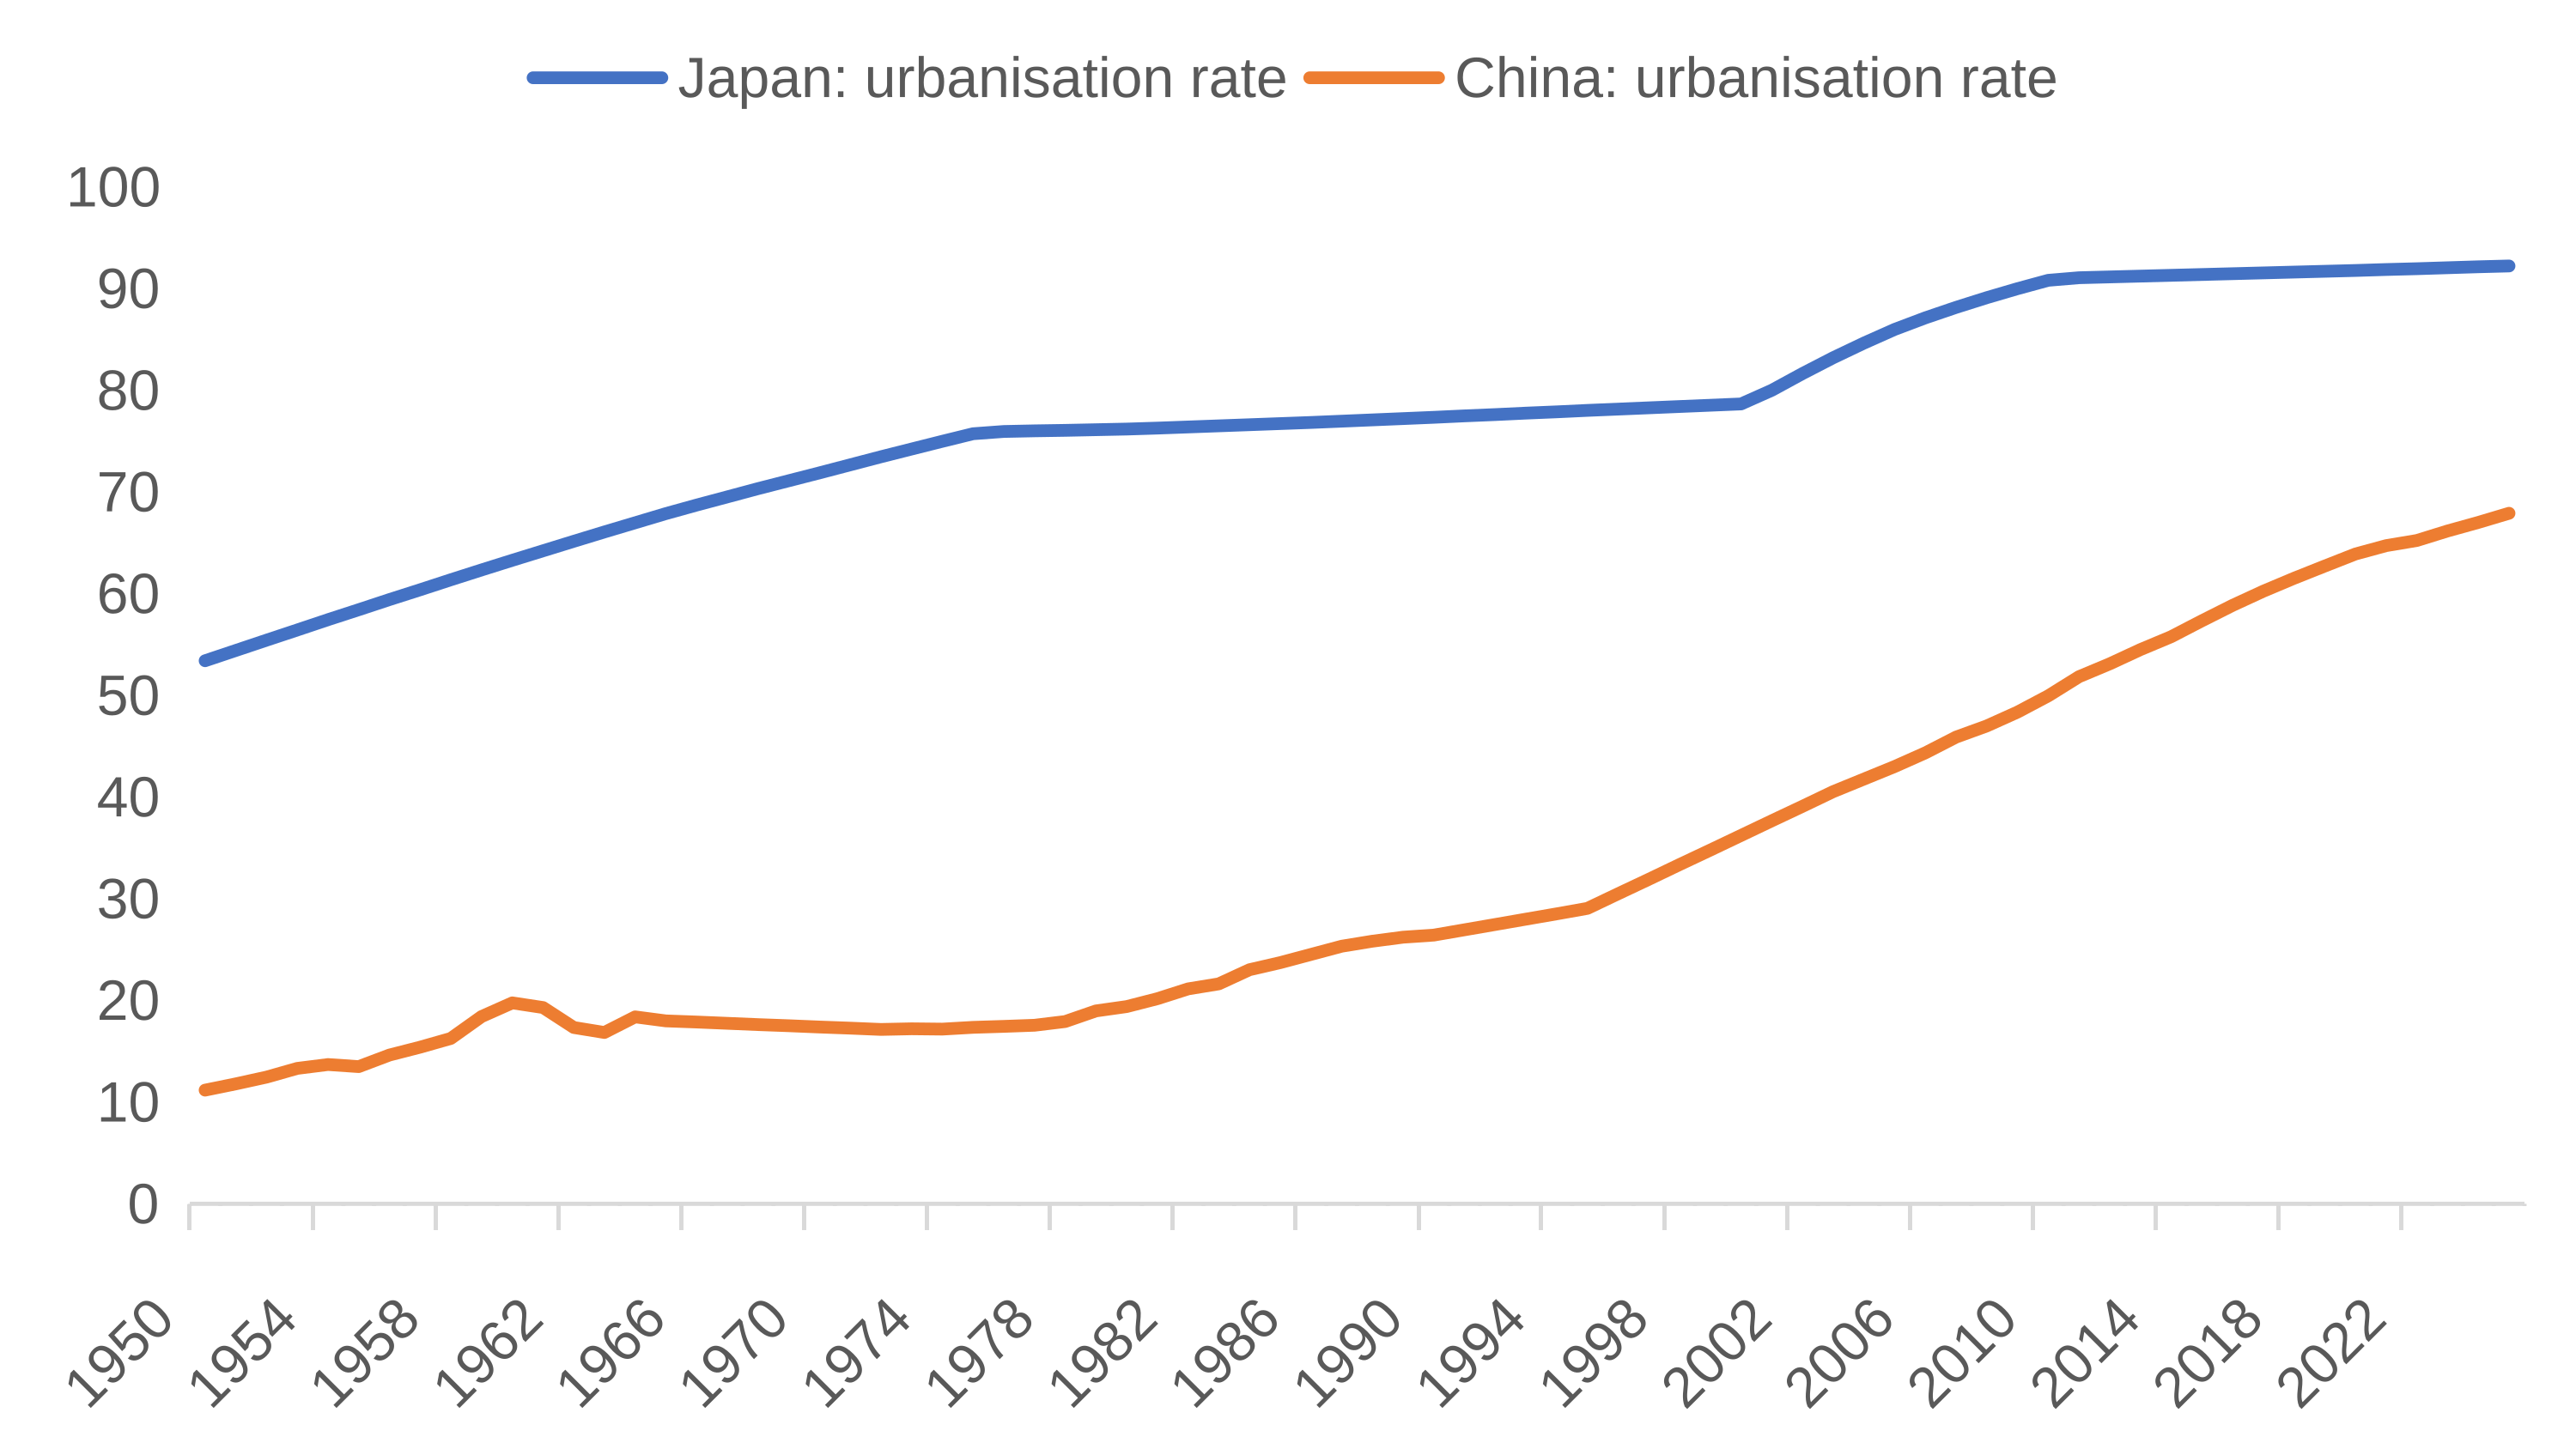
China may enter a similar phase around 2030, after its urbanisation rate reaches 70 per cent. China has less room for further urbanisation than Japan and many Western countries, partly because it is ageing before becoming fully affluent. Once a society becomes deeply aged, population mobility declines, and will weaken further as ageing accelerates.
Urban–rural gaps in China’s basic healthcare mean that life expectancy remains lower in rural areas than in cities. The rural population is therefore likely to decline naturally at a faster rate, pushing up the national urbanisation rate. Meanwhile, continued metropolitan concentration is causing many third-, fourth-, and fifth-tier cities to lose population. Together with natural population decline, administrative changes such as converting counties into urban districts can turn some rural residents into urban residents without any actual migration.
Regional Migration Through the Lens of Industrial Development
Manufacturing Export Cycles Create Population Tides
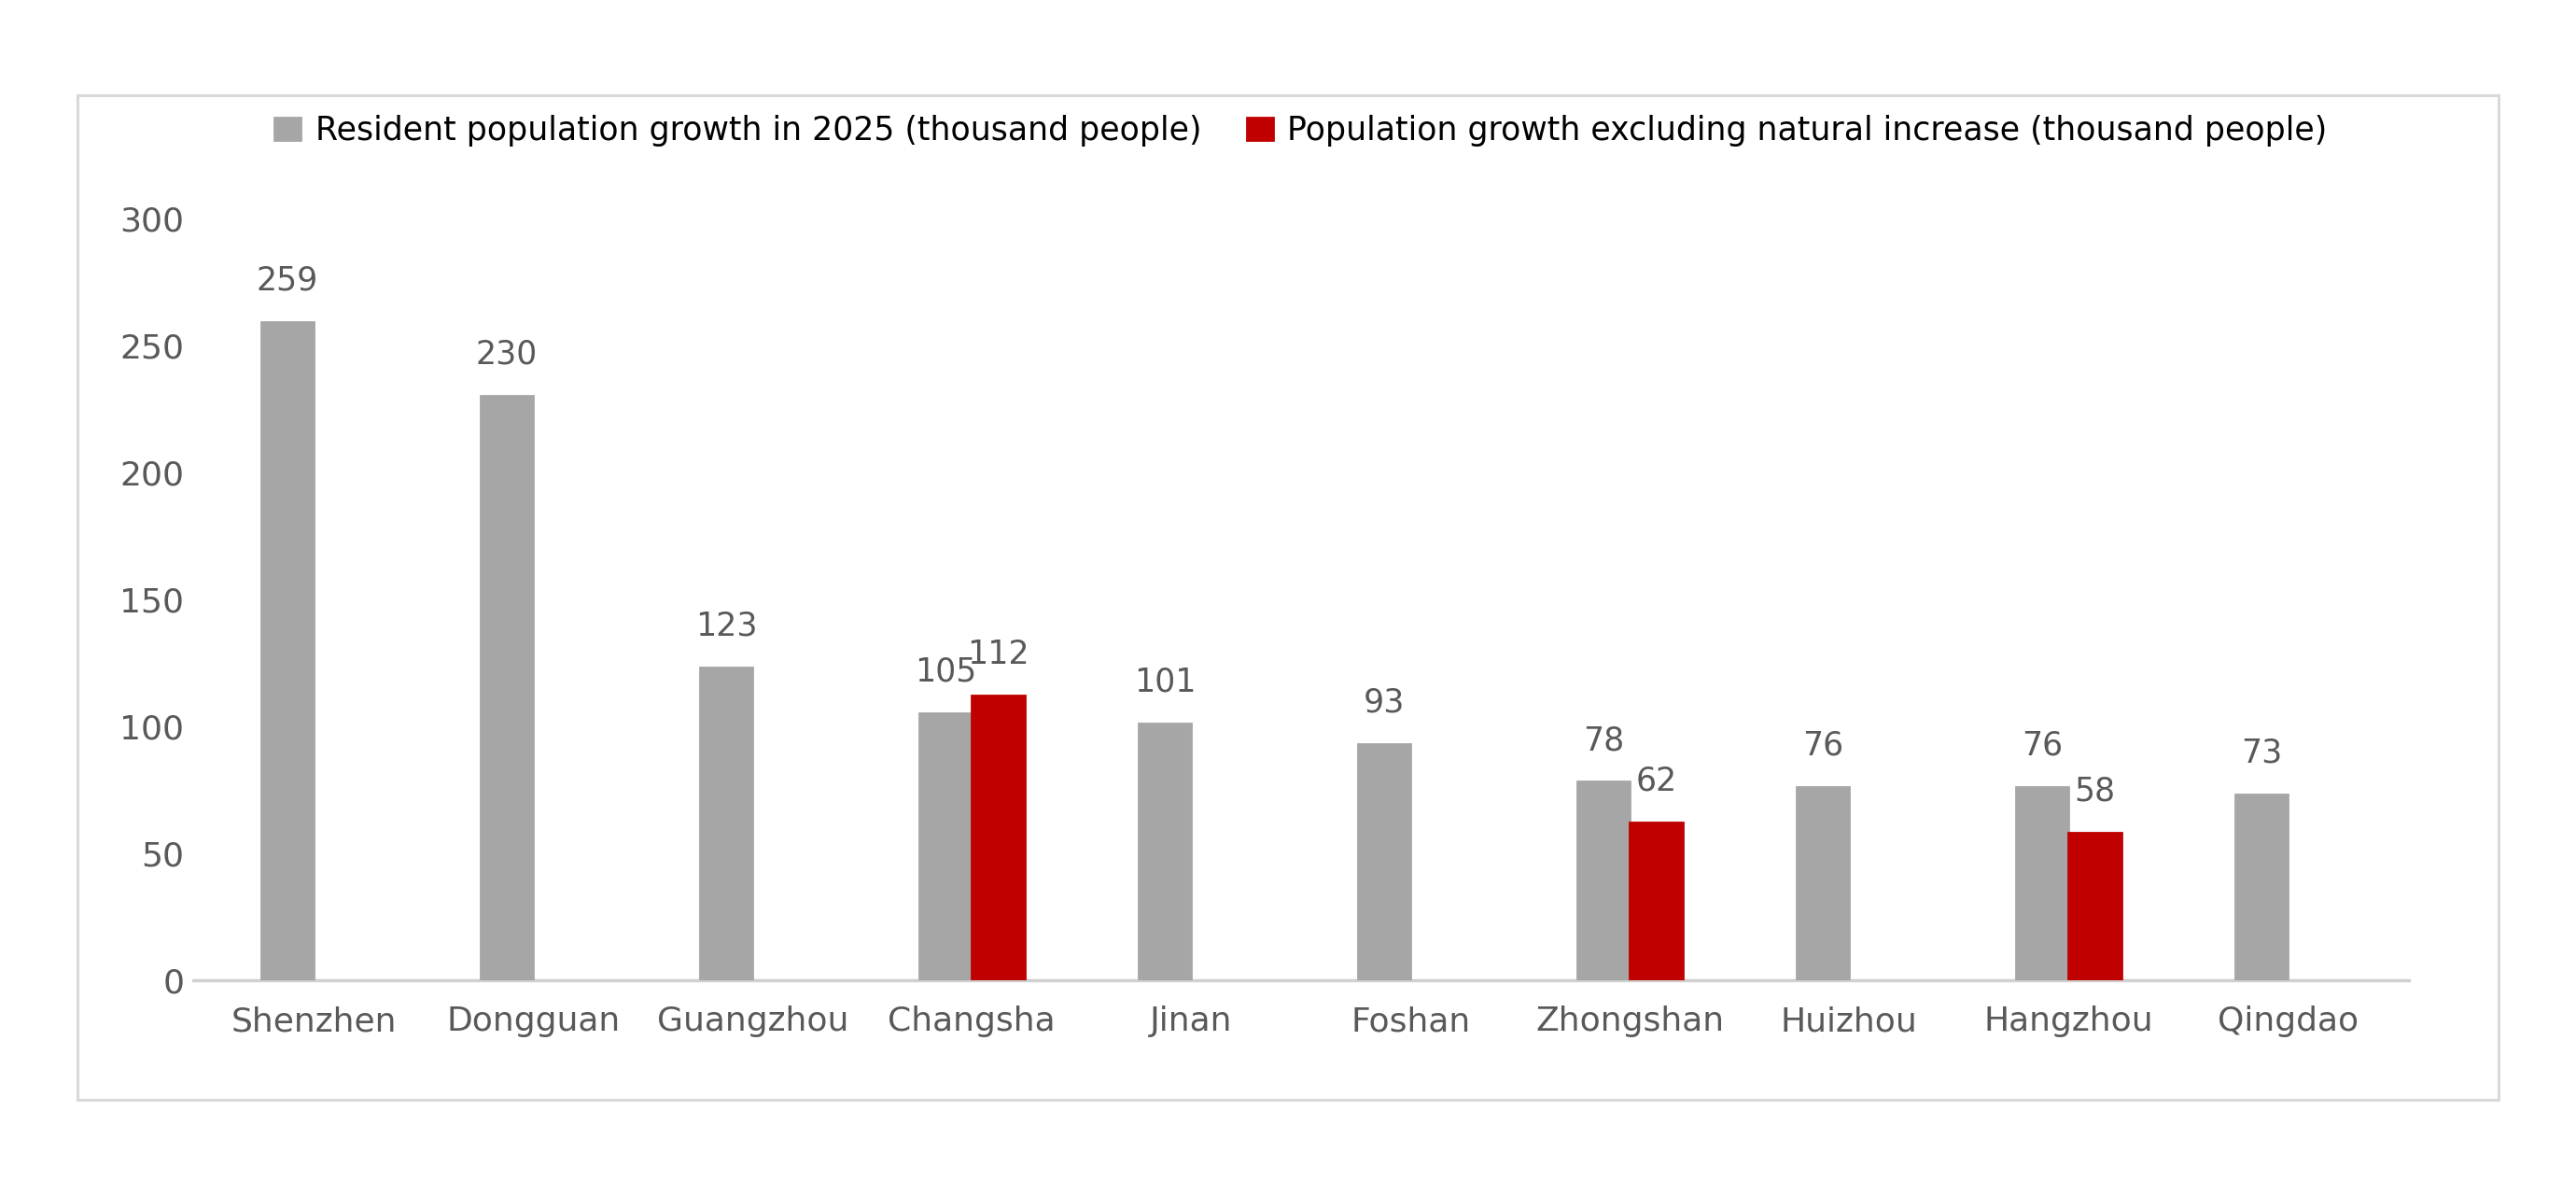
Guangdong’s resident population increased by 790,000 in 2025, including 290,000 from natural population growth and 500,000 from net migration from other provinces. Even after natural growth is excluded, Guangdong remained the country’s largest destination for migrants, well ahead of Zhejiang’s net inflow of 389,000 and Jiangsu’s 227,000. Six of the ten Chinese cities with the largest population gains in 2025 were in Guangdong. In addition to the strong pull of the two first-tier cities, Shenzhen and Guangzhou, major manufacturing and export centres such as Dongguan, Foshan, Zhongshan, and Huizhou also continued to attract migrants.
Figure 24. China’s Ten Cities with the Largest Population Gains in 2025
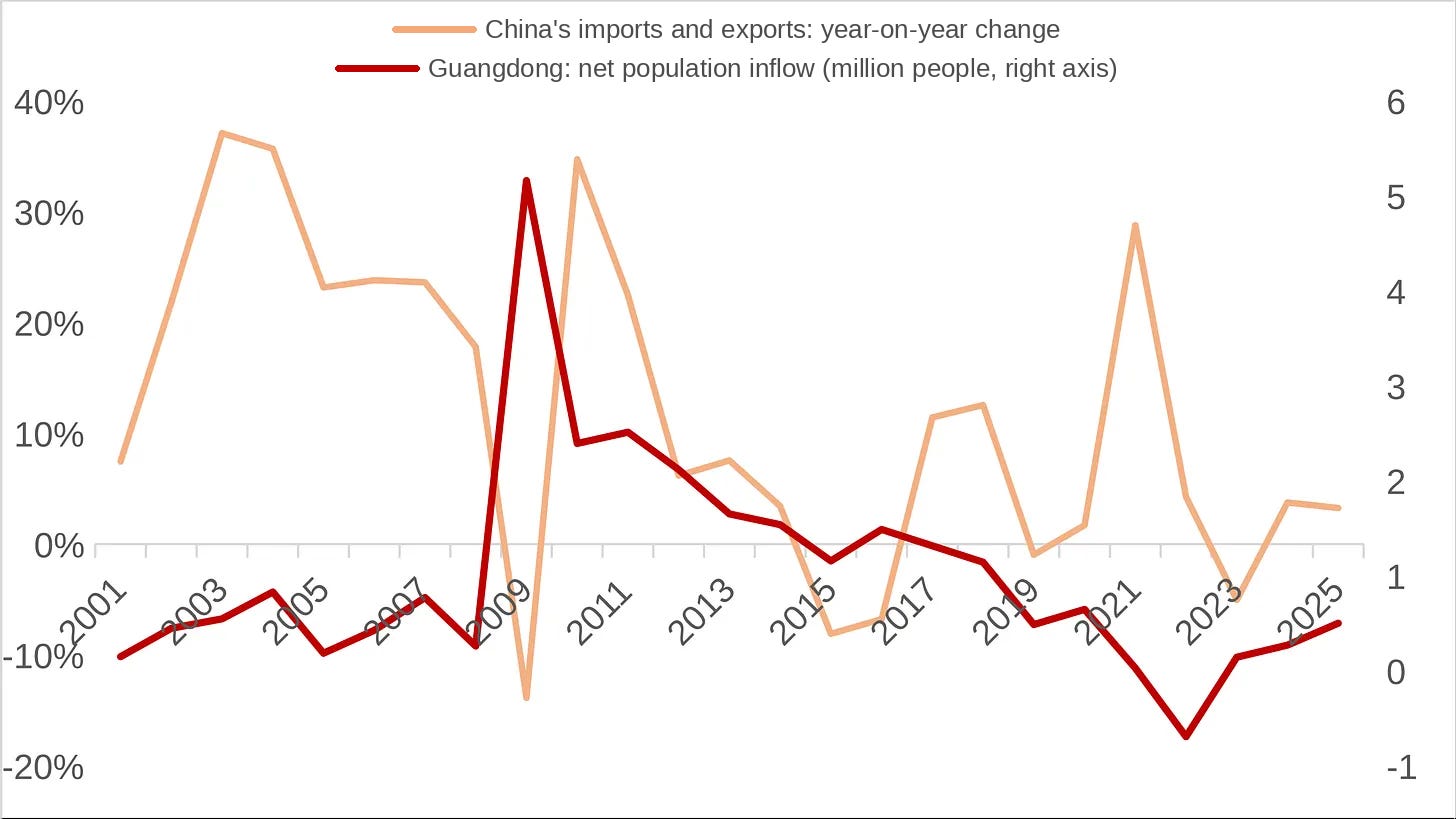
Manufacturing is the backbone of Guangdong’s economy. After natural population change is excluded, the province’s net inflows show a strong positive relationship with China’s export growth. Between 2000 and 2019, when Chinese exports expanded rapidly, Guangdong consistently ranked first nationwide in net migration. When exports came under pressure in 2022 and manufacturing employment contracted, population inflows slowed markedly. As exports recovered in 2024 and 2025, Guangdong returned to first place.
Figure 25. Net Population Inflows into Guangdong and Growth in Imports and Exports
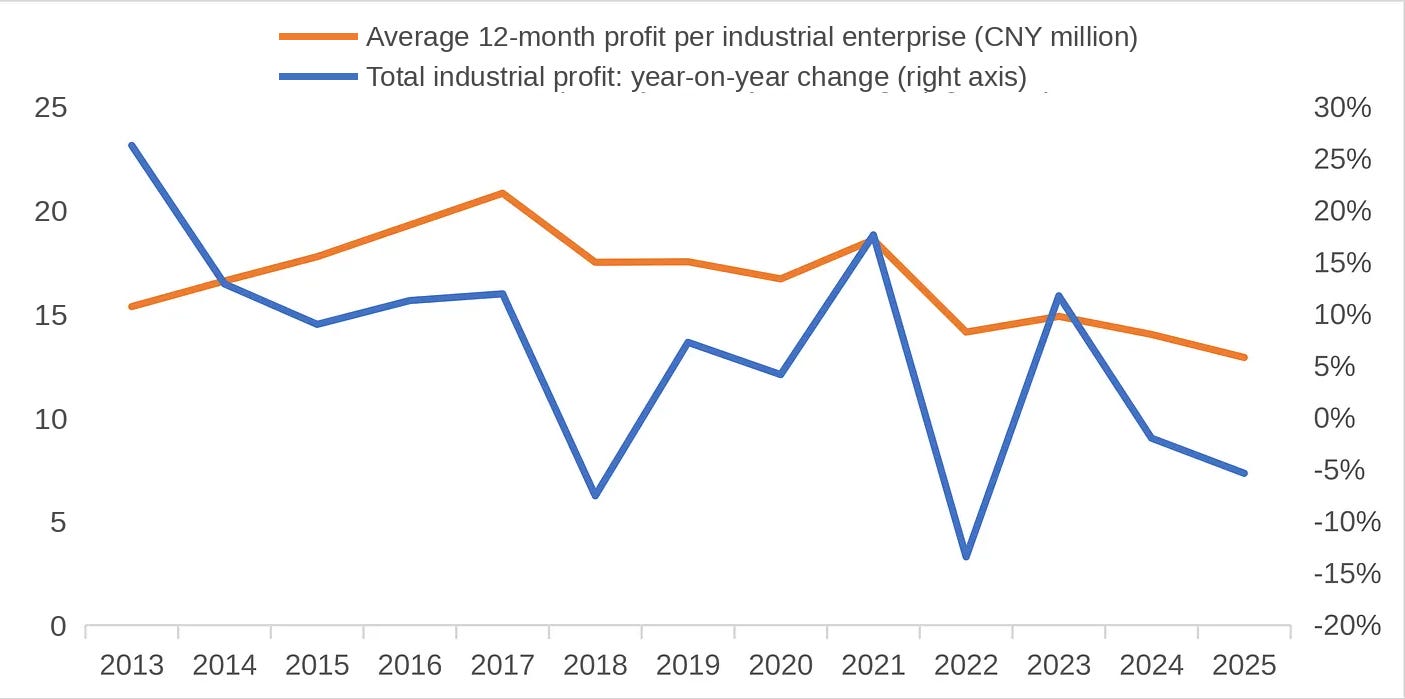
Looking ahead, the profitability of traditional manufacturing is likely to remain under long-term pressure. Conventional manufacturers will find it difficult to create large numbers of new routine jobs simply by expanding capacity. As the working-age population shrinks and industrial robots and artificial intelligence are adopted more widely, manufacturing’s capacity to absorb low-skilled workers is likely to decline year by year.
Figure 26. Profits of Industrial Enterprises in Guangdong Province
A Vibrant Private Sector and Digital Economy Act as a Magnet for Migrants
The Yangtze River Delta is already relatively aged, so population growth depends heavily on inward migration. In 2025, Zhejiang recorded a natural population decline of 79,000 and Jiangsu one of 307,000. After natural change is excluded, however, the two provinces recorded net interprovincial inflows of 389,000 and 227,000 respectively.
Fast-growing small businesses, e-commerce, and cross-border trade in cities such as Hangzhou have created a large number of flexible jobs. Relatively low barriers to starting a business attract not only employees but also entrepreneurs. Jiangsu, meanwhile, has a strong foundation in advanced equipment, chemicals, biopharmaceuticals, semiconductors, and other high-end manufacturing industries. The dense concentration of high-tech firms in industrial parks across southern Jiangsu makes the province especially attractive to skilled technicians and science and engineering graduates.
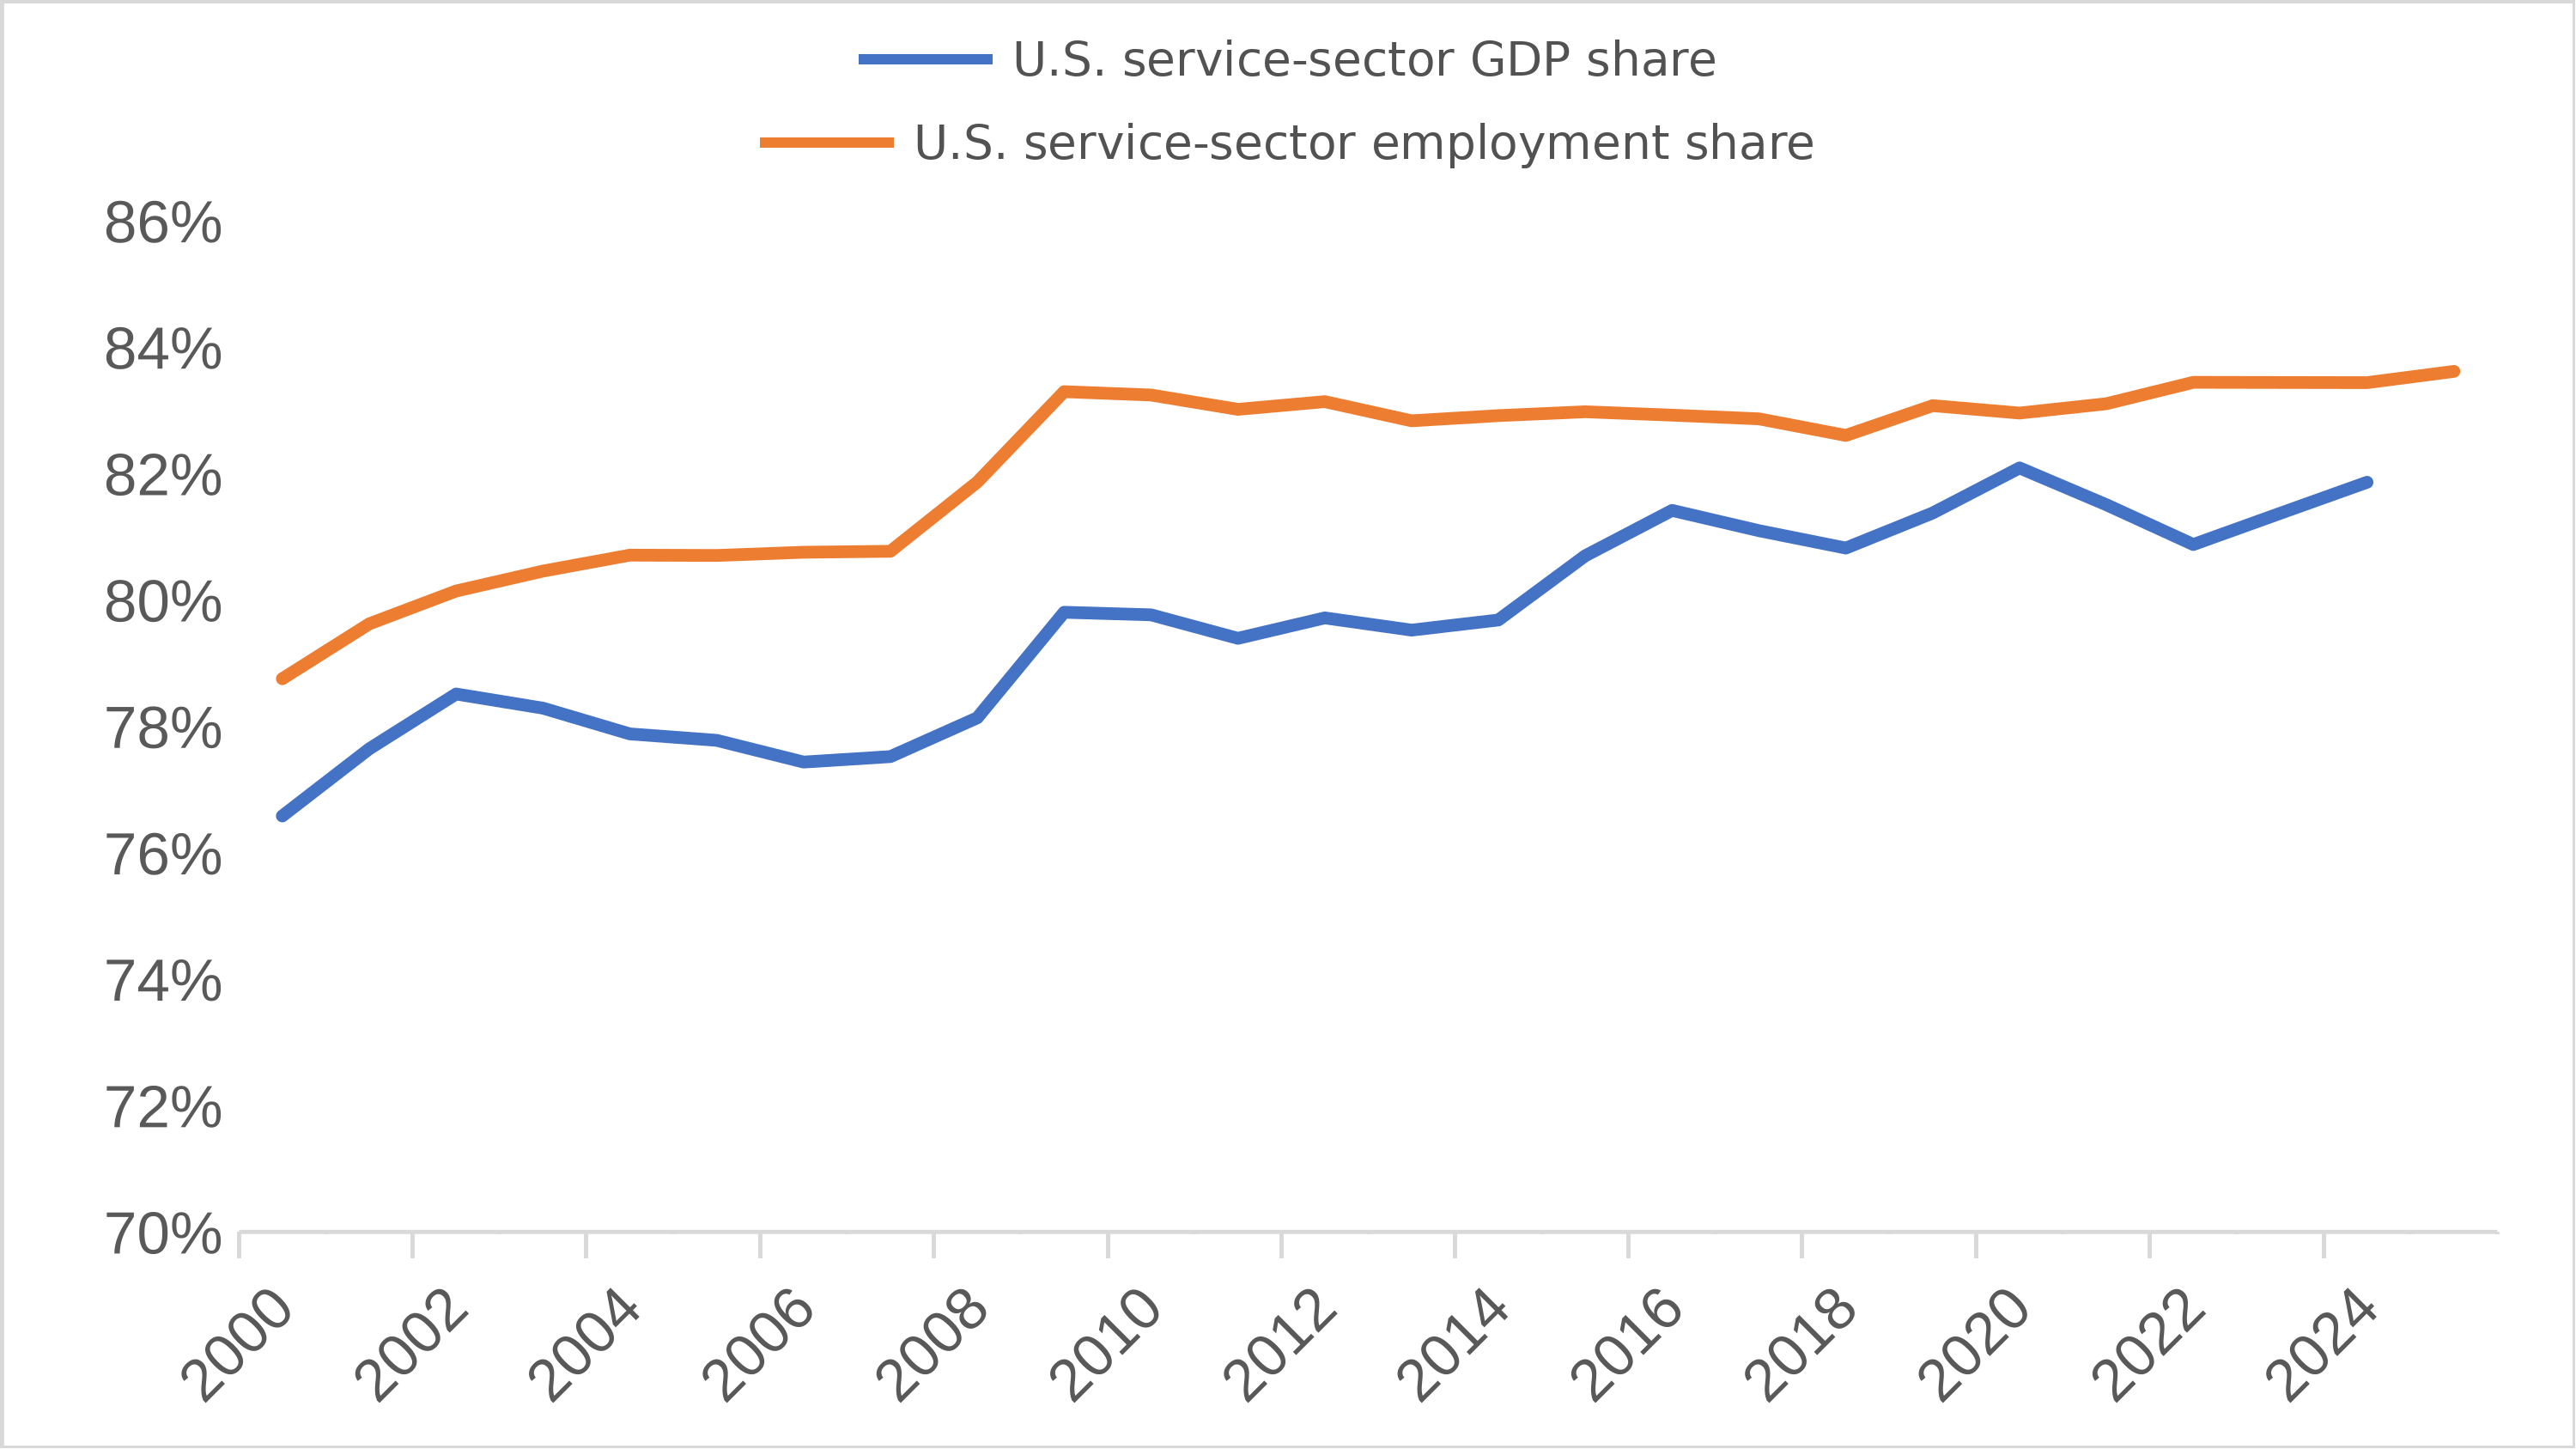
High-tech industries and services are likely to account for an ever larger share of employment. Under China’s statistical classification, the tertiary sector currently produces 57 per cent of GDP but employs only 49 per cent of the workforce, leaving an eight-percentage-point gap. In the United States, by comparison, services have long accounted for a slightly larger share of employment than of GDP; in 2025, the sector employed 84 per cent of the workforce.
Figure 27. China’s Service Sector Has Considerable Room to Expand Employment
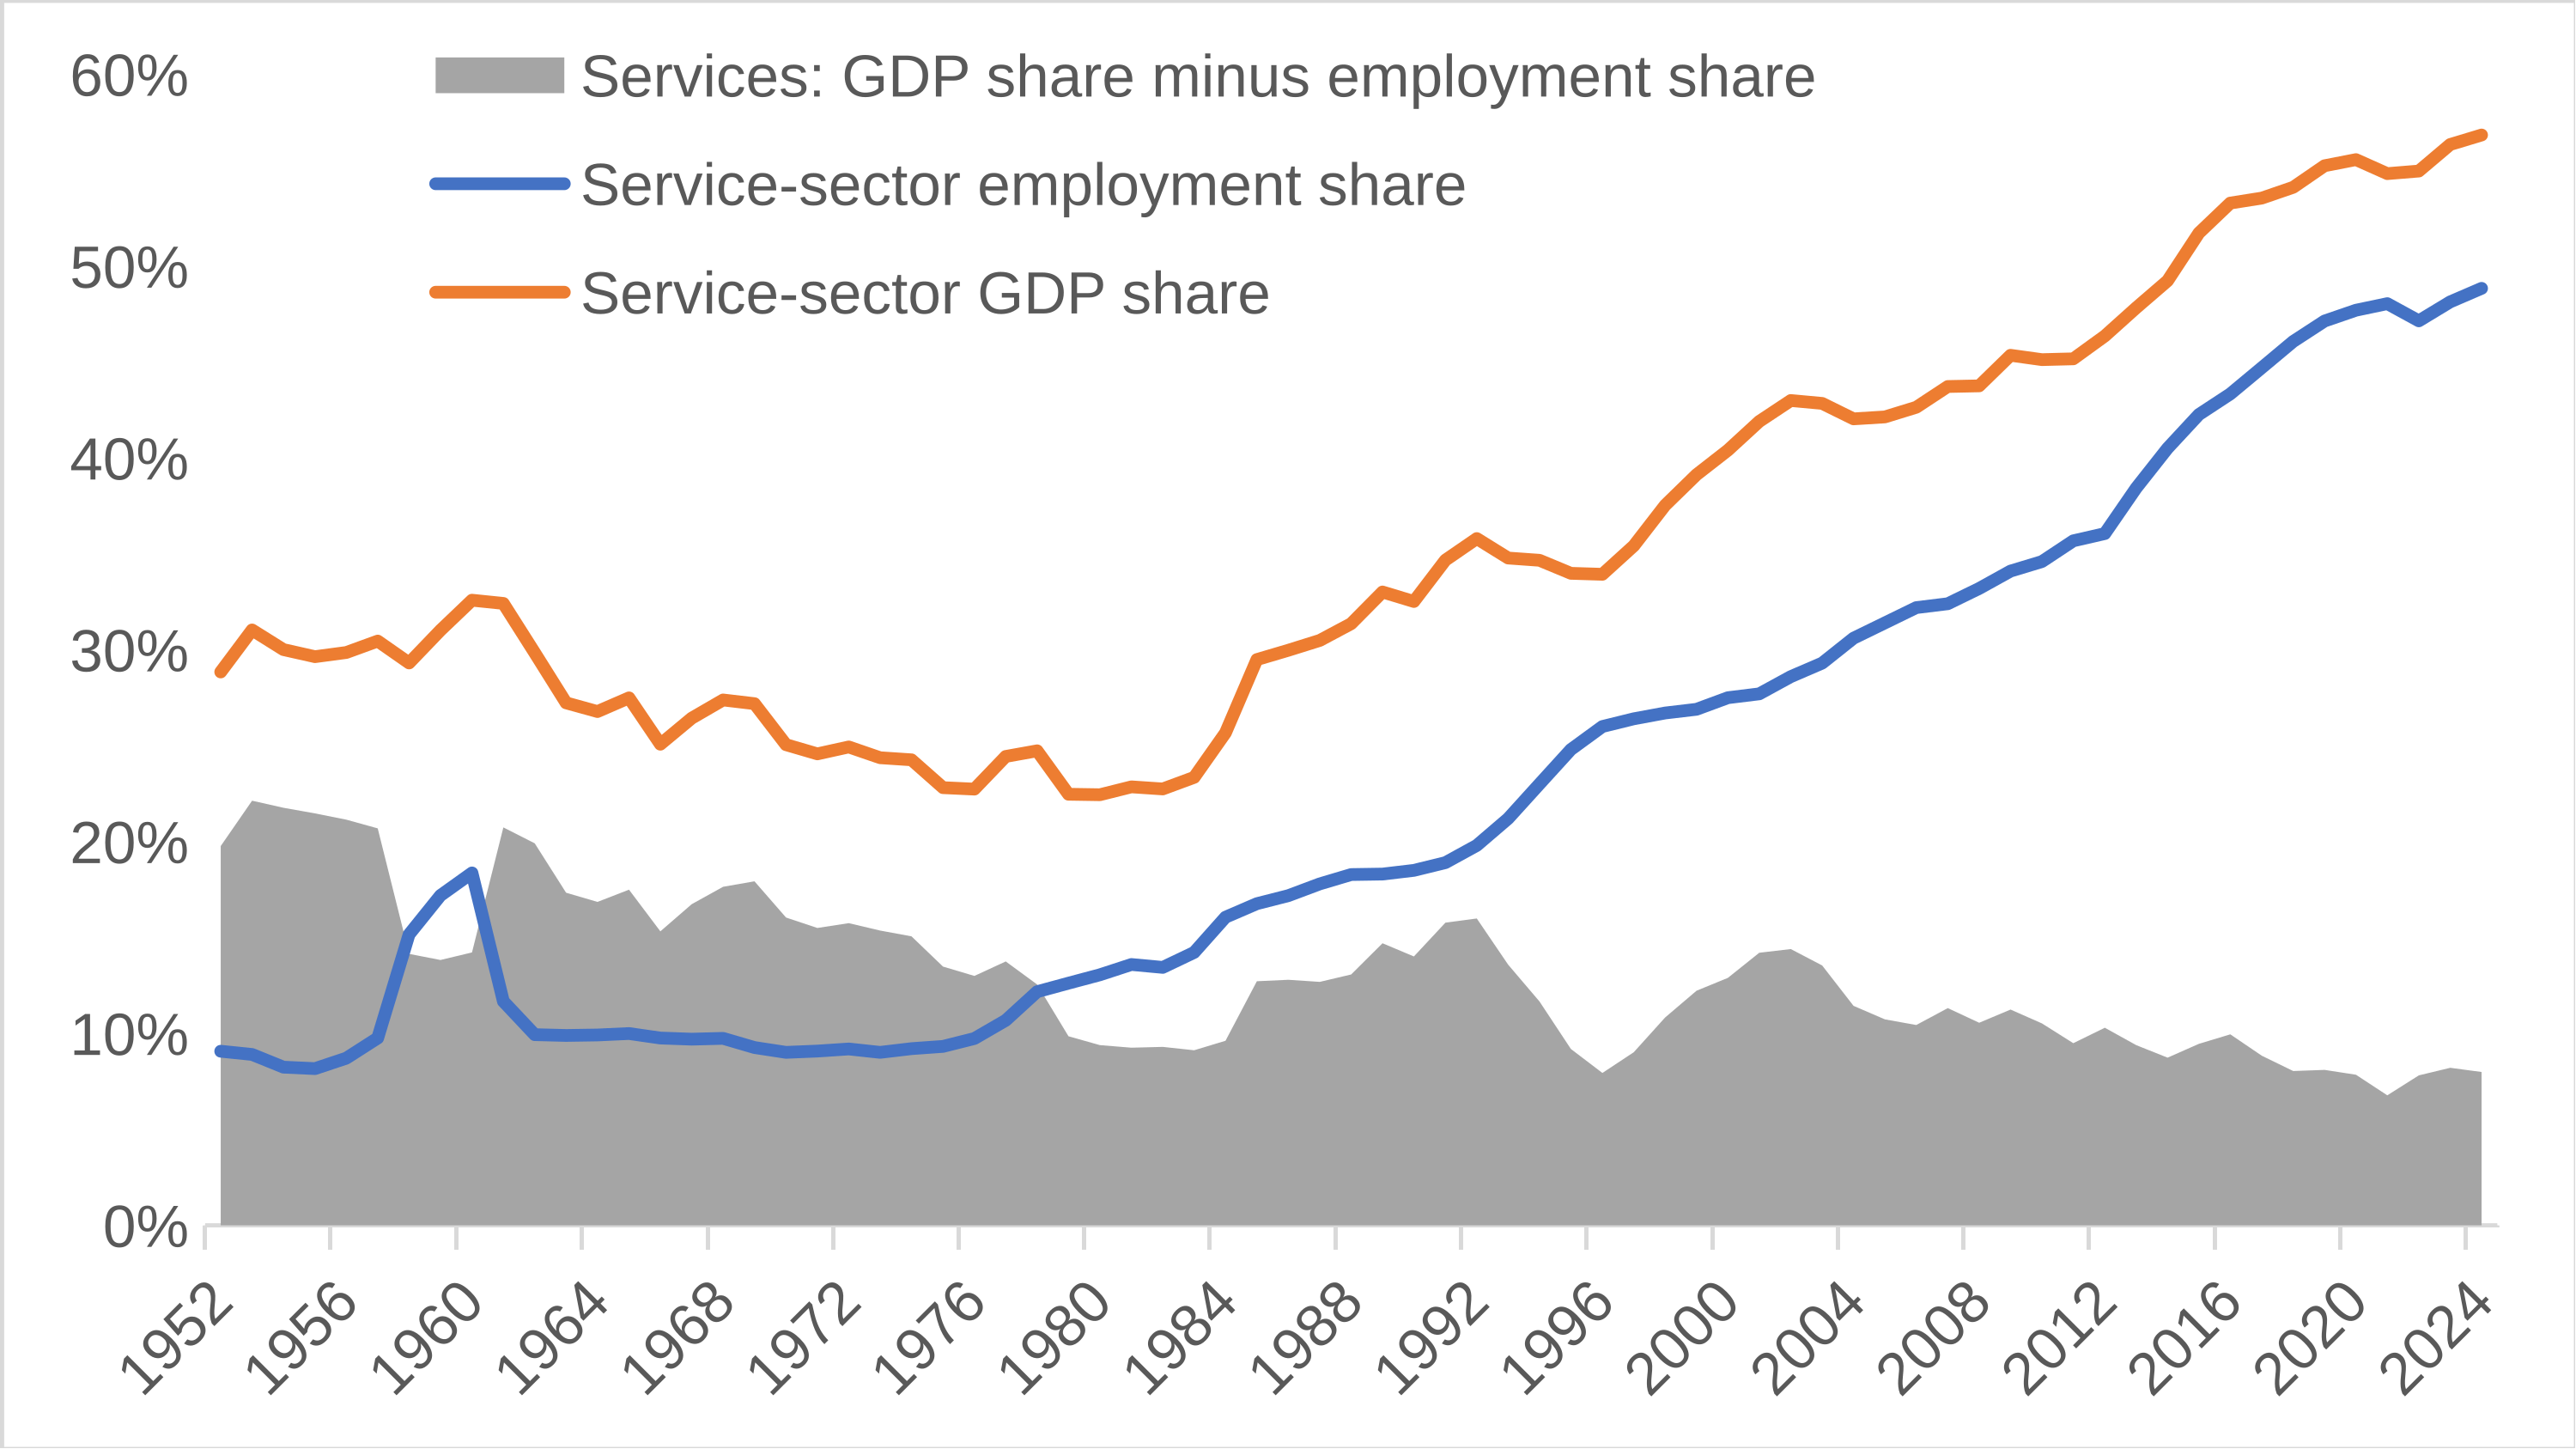
Figure 28. The Service Sector’s Share of U.S. Employment Has Long Exceeded Its Share of GDP
China’s high-tech industries are still expanding rapidly in both scale and revenue. The growth of high-value-added industries and the wage premium they offer draw young people and skilled workers across regional boundaries. Supporting service workers then follow, creating a complete ecosystem of population concentration. Zhejiang, Shanghai, and Jiangsu offer large numbers of jobs in advanced manufacturing, the digital economy, and services, making them the main drivers of population concentration in the Yangtze River Delta.
Figure 29. China’s High-Tech Industries Continue to Expand Rapidly in Scale and Revenue
Core Cities in Central and Western China Are Drawing People Back
Central and Western China comprises 18 provinces and provincial-level municipalities, covers more than 70 per cent of the country’s land area, and is home to more than 500 million people. It is China’s strategic hinterland. The development of a unified national market is strengthening the region’s capacity to absorb industries relocating from elsewhere. Core cities such as Chengdu and Chongqing, Wuhan, Zhengzhou, Changsha, Xi’an, and Hefei are building complete industrial chains in electronic information, new-energy vehicles, advanced equipment, and other sectors. Their large local consumer markets are also supporting better urban amenities and making these cities more attractive to people seeking work closer to home.
Between 2017 and 2025, the resident populations of Chengdu–Chongqing, Wuhan, Zhengzhou, Changsha, Xi’an, and Hefei each increased by more than one million. Chengdu led with an increase of 5.49 million. These cities continued to gain population in 2025. Although Chongqing’s total resident population declined, the fall was mainly due to natural population change. Once that factor is excluded, Chongqing recorded a net inflow of 115,000 in 2025, ranking fourth among all provinces and provincial-level municipalities.
Figure 30. Manufacturing Centres in Central and Western China Draw Population from Surrounding Areas
Central and Western China is also rich in coal, oil and gas, minerals, wind, and solar resources. As energy and mineral inputs become more important to emerging industries, resource-development projects are creating large numbers of jobs and supporting related industries. They attract skilled workers and professionals from other provinces while also offering employment to rural workers within the region. This helps retain younger local residents and reduce labour outflows.
Figure 31. Resource-Based Urban Development Drives Population Growth
Over the long term, ageing will continue to reduce population mobility. Even so, metropolitan concentration is likely to persist because large cities provide better public services and more job opportunities than small and medium-sized cities. The number of Chinese cities with populations above 10 million will likely continue to rise. At the same time, some fifth-tier cities may eventually be administratively consolidated, much as many natural villages in rural China have been combined in previous decades.
A smaller population and declining mobility as a result of ageing will also make overcapacity in transport infrastructure an increasingly serious concern and add to fiscal pressure. Accelerating ageing will also widen funding gaps in the social-security system, requiring a growing share of public spending to support pensions and other social insurance programmes. These challenges require advance planning.
(Since 2022, local statistical authorities have released increasingly limited demographic data, particularly on births and deaths. This has made demographic research and forecasting more difficult, and we appreciate readers’ understanding.)
Li Xunlei warns against excessive industrial investment amid declining demand and population

Li Xunlei is Chief Economist at Zhongtai Financial International Limited and has worked extensively at other Chinese securities companies, including Junan Securities, Guotai Junan Securities, and Haitong Securities. He is one of the most renowned chief economists among major domestic securities firms in China.
Li Xunlei: a data-driven analysis of China’s economy challenges conventional wisdom

Li Xunlei is Chief Economist at Zhongtai Financial International Limited. Li has worked extensively at other Chinese securities banks, including Junan Securities, Guotai Junan Securities, and Haitong Securities. He is one of the most renowned chief economists among major domestic securities firms in China.
Li Xunlei: one billion people in China have never been on a plane

“One billion people in China have never been on a plane” has become a minor meme to be wheeled out whenever the conversation turns to weak consumption and an economy short of effective demand. It was first put forward in early 2019 by Li Xunlei, one of the most renowned chief economists among major domestic securities firms in China, as a warning that “…
Calculating the cost of childbearing in China: the formidable factor behind country's dwindling birth rate

On Nov. 11, 2023, the National School of Development at Peking University hosted a session on the employment and family choices of Chinese women. This event took place amid the escalating challenge of China's declining birth rate, which resulted in a
Over 5% Chinese women embrace life without children, surging in the 2010-2020 period

Amid growing concerns over declining population and fertility rates in China, here are some revealing and compelling numbers on the prevalence of lifetime childlessness among Chinese women:
Bride Price and China’s Young Male Migrants

Caili, or bride price, is the money or goods a groom’s family gives to the bride’s family before marriage. It is an old Chinese custom, but in recent decades it has become one of the country’s most contentious marriage costs.
Chinese countryside’s quieter strains

China’s high-end industries keep chalking up technical breakthroughs. But one Spring Festival trip back to the countryside suggests that, at least in some parts of the country, many people are still waiting to feel the benefits. In a personal homecoming essay, the author describes a local economy where casual work has dried up, wages feel under pressure…