
Li Xunlei: a data-driven analysis of China’s economy challenges conventional wisdom
Leading economist reveals China’s export slump, speculative trading in small-cap stocks, and real estate market indicators.


Li Xunlei is Chief Economist at Zhongtai Financial International Limited. Li has worked extensively at other Chinese securities banks, including Junan Securities, Guotai Junan Securities, and Haitong Securities. He is one of the most renowned chief economists among major domestic securities firms in China.
In the following article, Li draws on decades of data analysis to challenge conventional views on China’s economy:
Despite significant contributions from exports to China’s GDP, its share of global exports has been on a downward path since 2021. The trade surplus of over USD 1.19 trillion in 2025 is largely due to a falling export price index, combined with a stagnant PPI over the past 15 years—pointing to long-standing overcapacity that has persisted for more than a decade.
The idea that a rising stock market boosts consumption is flawed. A significant portion of Chinese stock market activity is driven by speculative trading in small-cap stocks, while large-cap A-share companies, dominated by traditional industries and state-owned enterprises, contribute little to trading value. This suggests that, despite economic upgrading, China still lacks large, high-growth, high-tech firms capable of driving significant market returns and broader consumption.
Real estate trends should be assessed using valuation metrics such as the rent-to-price ratio, as well as population mobility data. New-home sales volume is unreliable for predicting market bottoms. Changes in China’s share of global luxury consumption and fluctuations in the Chinese art price index may also serve as leading indicators, with changes in the Moutai price index acting as a coincident indicator.
—Yuxuan Jia

The article was published on Li’s personal WeChat blog on 22 February, 2026. Li has kindly authorised the translation.
透过交易数据看清表象背后的真实经济
Seeing the True Economy through Transaction Data
Over more than 30 years of research, I have been dealing with all kinds of data, because only accurate data and careful cross-comparisons can produce genuinely convincing conclusions. When confronted with data, all adjectives and exclamation marks seem insignificant.
A market economy, in essence, consists of various transactions under continuously changing supply-and-demand relations. In my view, transactions can be broadly divided into two types: one is transactions in goods and services in the real economy; the other is transactions in money, marketable securities, and derivatives in the virtual economy. By looking through these transactions and the data they generate, one can gain a deeper understanding of the Chinese economy and even the global economy, or correct one’s own cognitive biases, and also better grasp future trends and investment opportunities. This piece is a reflection rather than an academic paper; I simply want to share how I use those data to reach conclusions that differ from common perceptions.
Below, I use several cases drawn from transaction data to discuss my understanding of the economy and how certain cognitive biases can be corrected.
Correcting cognitive bias through export data: reading “strong supply, weak demand” and the room for RMB appreciation
In 2025, net exports contributed 32.7% to China’s GDP growth, nearly one-third. As a result, many assume China’s export growth must have been very strong. In fact, however, China’s share of global exports (in USD terms) declined in the first three quarters of 2025 compared to 2024, with the peak occurring in 2021. WTO data show that from 2022 through the first three quarters of 2025, only 2024 saw an increase in China’s share.
Fig 1. China’s share of global exports by value.
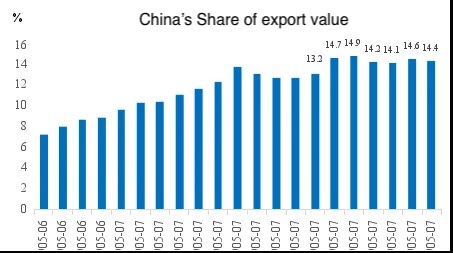
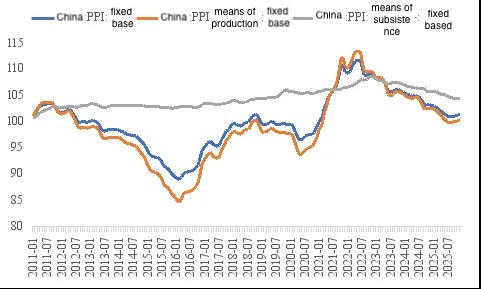
Why did China’s trade surplus exceed USD 1.19 trillion in 2025, despite a decline in its share of global export value? The answer lies in the continuous fall of China’s export price index (in USD). From 2023 to 2025, China’s export price index fell cumulatively by about 19%, far exceeding the declines seen in other developing economies. In fact, China’s PPI has registered zero increase over the past 15 years—what I call “the lost fifteen years.” This indicates that China’s overcapacity problem was already very pronounced more than a decade ago.
Fig 2. Since 2010, China’s fixed-base PPI index has shown zero increase.
While Chinese exports rely on a “price-for-volume” strategy to achieve relatively rapid growth, the large trade surplus reflects insufficient effective demand. In 2025, China’s imports grew just 0.5% year on year, signalling strong external demand but weak domestic demand. In other words, trade transaction data clearly highlight the “strong supply, weak demand” challenge currently confronting China’s economy.
From 2022 to the end of 2025, the RMB depreciated cumulatively by 16.1% over four years. As the USD begins to weaken, there is significant potential for RMB appreciation in the future. This is because China has set the goal of achieving a “reasonable rebound” in prices and aims to become a moderately developed country by 2035. RMB appreciation would help restore export prices and, in addition, could boost China’s per capita GDP, thereby narrowing the gap with developed economies.
Will Africa become the next global investment hotspot?
From 2019 to 2025, among China’s major trading partners, the shares of China’s exports going to ASEAN, Africa, Russia, India, and Mexico increased by 3.26, 1.44, 0.75, 0.61, and 0.51 percentage points, respectively. Over the same period, the shares going to the United States, the European Union, Japan, South Korea, and the United Kingdom declined by 5.61, 2.31, 1.56, 0.62, and 0.24 percentage points, respectively.
Fig 3. The increase in China’s export shares is mainly driven by emerging economies.
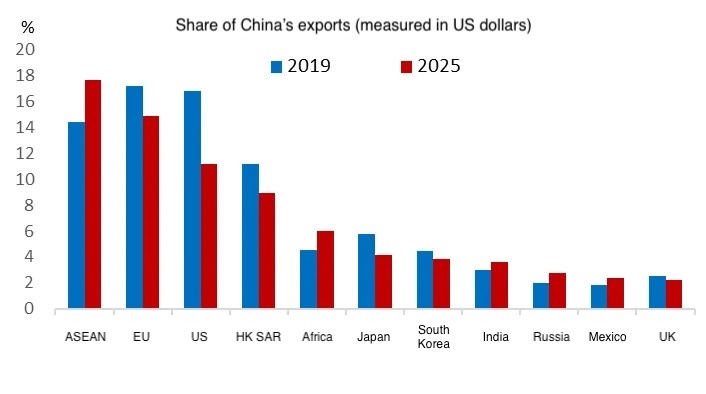
Exports to ASEAN recorded the highest growth rate, but there may be “re-export” effects at play. In contrast, exports to Africa are likely closer to final-destination exports. Africa is the least developed region in the global economy. From January to November 2025, China’s exports to Africa grew by 26.3%, indicating very strong demand. China’s total population has declined for four consecutive years, whereas Africa is set to become the youngest continent by population in this century, enjoying a demographic dividend similar to China’s in the 1990s. Africa’s urbanisation rate is also relatively low, which means its urban population is likely to grow rapidly in the future. Both the duration of the demographic dividend and the potential for urbanisation may surpass India’s, signalling significant investment opportunities.
By comparison, India’s total fertility rate has fallen to 1.9, and the country will soon enter population ageing. Therefore, investing in Africa may be a rational choice, much as foreign direct investment (FDI) flows into the Chinese mainland in the 1990s ranked first globally in the 1990s, while today, China has become a net capital outflow country.
Human societies go through stages of development. Europe is in its twilight years; ageing is accelerating in East Asia; India has become the world’s most populous country, but likely will struggle to escape the “growing old before growing rich” trap. Looking at the first half of this century, China should be the terminal destination of the global relocation of manufacturing, but it faces the pressures of overcapacity and excess capital, making outbound investment and capital exports an inevitable choice.
Reading China–U.S. differences through stock market transaction data
There is a wealth of stock market data, and I am selecting just a few interesting indicators. The figures presented below are from 2024. While some may not be the most recent, they still reveal key characteristics and differences between the Chinese and U.S. economies. For instance, in 2024, stocks with a market capitalisation below RMB 30 billion accounted for 63.4% of total Chinese mainland A-share trading value. In 2016, this share was as high as 76.7%. By contrast, in the U.S. market, stocks with a market capitalisation below RMB 30 billion was only 7.1%. Meanwhile, in the Chinese mainland A-share market, stocks with a market capitalisation above RMB 100 billion accounted for just 17.7% of trading value, while in the U.S. market, stocks above RMB 100 billion equivalent made up 81.3%.
However, for Chinese mainland A-share companies with a market capitalisation below RMB 30 billion, total profits in 2024 accounted for only 13.2% of the total profits across all A-share listed companies. This suggests, on the one hand, a relatively strong speculative element in the A-share market. On the other hand, it may reflect weaker growth potential among large-cap A-share companies, which are dominated by traditional industries, state-owned enterprises, and cyclical stocks. It also indicates that while China’s economy is upgrading, it still lacks large, high-growth, high-tech firms.
As of February 7 this year, the “Magnificent 7” in the U.S. stock market accounted for 30% of the S&P 500’s total market capitalisation. Over the past decade (2016–2025), their combined return reached 40.48%, far exceeding the S&P 500’s 14.11% increase over the same period.
In comparison, China’s CSI 300 index has delivered an annualised return of only about 4.6% over the past decade. The substantial gap can largely be attributed to differences in return on equity (ROE), with the U.S. level approximately double that of China’s. For example, between 2020 and 2024, the average ROE of the CSI 300 was 9.96%, while that of its U.S. counterpart was 18.5%.
Today, the largest U.S.-listed company by market capitalisation is NVIDIA, valued at USD 4.6 trillion. In contrast, the largest Chinese mainland A-share company by market capitalisation is Industrial and Commercial Bank of China (ICBC), at just USD 365 billion. The largest company by market capitalisation in Hong Kong equities is Tencent, valued at USD 607 billion. Overall, the market-cap gap between U.S. large-cap stocks and small- and mid-cap stocks have continued to widen, demonstrating clear polarisation. While polarisation in A-shares is also a trend, it has progressed more slowly.
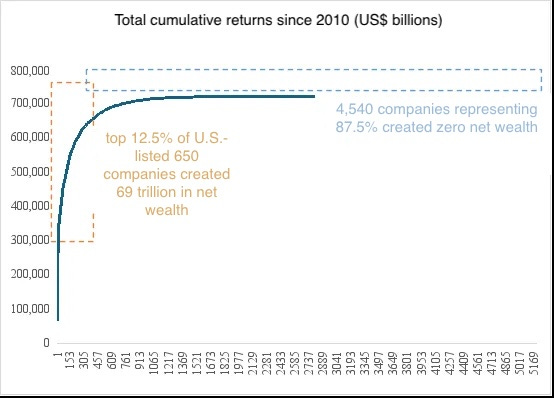
Statistics show that from 2010 through the end of July 2024, the 650 U.S.-listed companies representing 12.5% of the market generated a total of USD 69 trillion in net wealth, while the 4,540 companies representing 87.5% created zero net wealth. In 2024, the “Magnificent 7” contributed more than 50% of the S&P 500’s gains.
Fig 4. Since 2010, 12.5% of companies have contributed to all U.S. equity market cap growth.
Polarisation in the U.S. stock market inevitably leads to a higher Gini coefficient. For instance, the U.S. income Gini coefficient was 0.488 in 2024, compared to just 0.4 in the 1980s. The wealth Gini coefficient, estimated based on a 2025 wealth report, was 0.74, placing the U.S. among the world’s “high inequality” group. As of the first three quarters of 2025, the wealthiest 1% of U.S. households held nearly 32% of national wealth, a historical high.
After World War II, Gini coefficients in major economies, including the United States, have continued to rise— for example, they were around 0.2 in the 1970s. Economic growth in many countries has increasingly relied on debt-driven models. This is the structural feature I often emphasise: in peacetime, K-shaped divergence becomes an “inevitable” economic pattern.
Going forward, both China and the United States will face dramatic changes in industrial structure and employment due to the AI era, as the AI industry may experience exponential growth. In the past, the market capitalisations of internet companies easily surpassed those of traditional industries like petrochemicals and banking. Today, AI companies’ market capitalisations may surpass those of internet firms as well, much like how NVIDIA’s market capitalisation has already exceeded that of Amazon and Google.
Stock market transaction data clearly show that China’s manufacturing share of global output is already very high—around one-third. However, China lacks large companies with global influence and significant market shares. In other words, China is large but not yet strong enough, and large but not “excellent” enough. Achieving high-quality development will still require further institutional optimisation.
Employment may become a major problem in the future, because more and more industries will be partially replaced by AI applications, such as software, accounting, legal services, consulting, and later potentially, medical and education services, as well as parts of manufacturing. The rise of the internet around 2000 transformed offline business models into online models, but online models still required large numbers of employees to provide supporting services. AI, by contrast, directly substitutes labour with artificial intelligence and intelligent robots.
By the end of 2025, China’s flexible employment population had exceeded 287 million. This group primarily consists of food delivery riders, ride-hailing drivers, and livestreamers. These types of employment, which are highly dependent on internet platforms, are also particularly susceptible to being replaced by AI.
Since 2011, China’s working-age population has been declining in net terms, and since 2013, manufacturing employment has also started to decrease. However, the ongoing decline in the working-age population has not led to labour shortages, and pressure on employment remains significant. As ageing accelerates, the elderly population is expected to surge, and this rapid growth trend is projected to continue through 2033.
Fig 5. Major categories of fiscal expenditure in China over the past three years
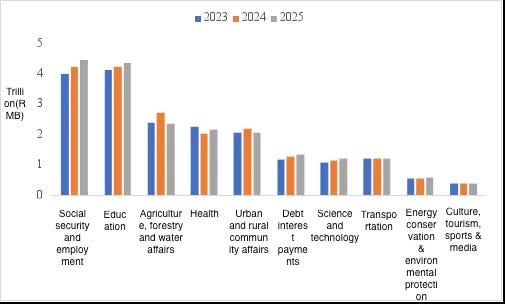
From this, it can be inferred that China’s fiscal spending on social security and employment will rise significantly over the next 5–8 years. In 2025, it already reached RMB 4.4 trillion, accounting for 15.4% of general public budget expenditures; by 2030, this share could approach 20%.
When will real estate bottom out? Observing through multiple types of transaction data
At the end of last year, I gave a media interview and was asked about my views on the housing market in 2026. I responded with, “Buying is not as good as renting,” because the rent-to-price ratio is too low. The video spread widely and sparked considerable controversy. Many challenged my stance, asking how an expert could draw such a conclusion based on a single rent-to-price ratio.
Not at all. The interview time was limited; if asked to explain real estate in depth, I could talk for an entire day. Over the 20-year housing bull market, I have continuously tracked indicators related to real estate cycles. For example, in early 2017, I wrote “Six Dimensions to View Future Housing Prices,” and on that basis, at the 2017 Boao Forum for Asia, I predicted that China’s real estate market would peak around 2020.
I used to track the correlation between Macau’s annual gaming revenue and China’s real estate cycle. From 2001 to 2010, Macau’s gross gaming revenue increased tenfold, and by 2010, it was three times that of Las Vegas. This period coincided with China’s major housing bull market. However, after the introduction of the Eight-Point Regulation in 2012, the “transaction data” of Macau’s gaming sector became “decoupled” from mainland housing prices, so I stopped following it.
After 2012, I began tracking sales changes for Audi vehicles (previously used as official vehicles) and Moutai, and found that while Audi sales declined sharply, Moutai sales continued to rise. The reason behind this is quite interesting and is discussed in my research report, “Exploring Price Transmission: Baijiu, Pork, and Excavators.” As a result, Moutai’s transaction data became a lens through which I observed the housing market.
For example, the market price of standard Moutai produced and shipped in 2021 reached a historical high of RMB 3,078, before declining steadily. China’s housing market also peaked in 2021. Today, the price of standard Moutai shipped in 2026 is around RMB 1,670—almost halved—roughly mirroring the average decline in national housing prices.
Fig 6. The share of sauce-aroma baijiu (including Moutai) reached its peak in 2021
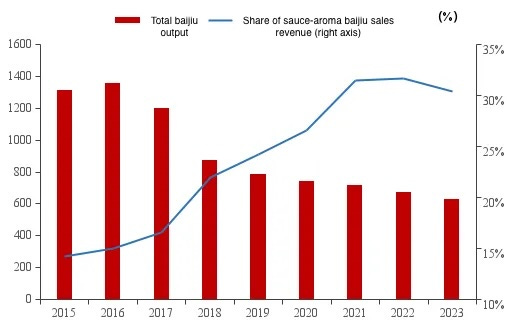
If we further examine the share of sauce-aroma baijiu (a category that includes Moutai) sales revenue in total baijiu sales, the peak also occurred in 2021.
Additionally, I have long tracked luxury goods sales. According to authoritative consulting institutions, China’s share of global luxury consumption peaked in 2019 at 35%, but fell to 23% in 2025. Meanwhile, the United States increased its share from 22% in 2019 to 31% in 2025. This raises the question: Could China’s share of global luxury consumption serve as a leading indicator of real estate conditions?
Another indicator I have long tracked is the art auction market—particularly the MM Art Indices compiled by Professor Mei Jianping. The index shows that the price indices for MM Chinese art, oil painting, and modern painting all peaked in 2020. By 2025, these indices continued to decline at an accelerating pace, with the market remaining relatively weak throughout the year and experiencing less vigorous bidding. Since 2020, cumulative declines have exceeded 50%.
Fig 7. MM Chinese Art Price Index, MM Chinese Ink Painting Index, MM Chinese Oil Painting Index, MM Chinese Modern Index, MM Chinese Contemporary Index 2025
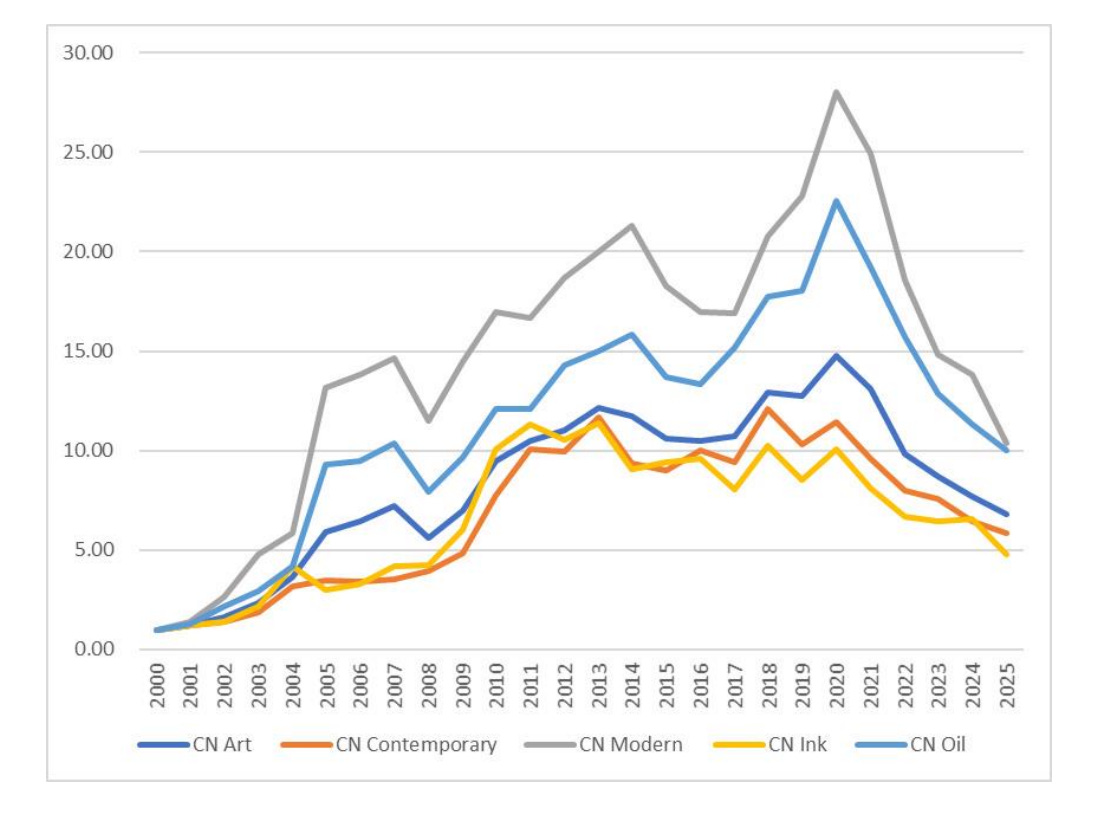
MM Art Indices find that the continued weakness in the Chinese art auction market stands in stark contrast to signs of partial recovery in the art price indices for four European countries (Italy, France, Germany, and the UK) and the Americas. Therefore, it may be useful to consider changes in China’s share of global luxury consumption and fluctuations in the Chinese art price index as leading indicators for the housing market, while treating changes in the Moutai price index as a coincident indicator.
Of course, this is only technical analysis. For trend analysis, one can examine population mobility data, which, in essence, is also a form of transaction data. For example, after 2015, population mobility in China began to decline, signalling that the urbanisation process had slowed—an indicator of weakness for the housing market. Next, one should look at the direction of population flows: after 2015, more than 80% of the migrant population moved to first- and second-tier cities. In other words, as overall urbanisation slowed while “big-city urbanisation” accelerated, the housing market shifted from a broad-based bull market to a structural bull market.
Accordingly, the logic of housing cycle evolution should follow this process: broad bull market → structural bull market → structural bear market → broad bear market. The National Bureau of Statistics regularly releases month-on-month housing price data for 70 large and medium-sized cities, and at the time, it was evident that the number of cities experiencing price increases was shrinking. This trend helps explain why I predicted in 2017 that China’s housing market would peak around 2020.
I often find that people who remain bullish on real estate cite two reasons. One is that China’s urbanisation rate could reach 80%, while it is currently only 65%. The other is that China’s hukou-based urbanisation rate is low and thus has more room to rise, so they believe real estate will rise over the long term. But these arguments do not stand up well. As ageing accelerates, population mobility will inevitably decline, and the number of people moving into cities will naturally fall. Moreover, an urbanisation rate of 80% could also be achieved through the natural decline of the rural population (rural mortality is higher than urban mortality).
As for the hukou-based urbanisation rate, it is even less meaningful, as two-thirds of China’s cities are experiencing population decline, with only a few exceptions, such as Shanghai. Yet even Shanghai has started aggressively competing for talent, as it has already become a “super-aged” city. By 2038, under current fertility rates, China’s total population may fall below 1.3 billion.
Many people attempt to predict when the housing market will bottom out based on new-home sales data. This is like using changes in stock market trading volume to determine when the equity market bottoms—yet in practice, stock investors rarely rely on trading volume to pinpoint a market bottom. Moreover, claims made three years ago that “once new-home sales area falls below 900 million square meters, the market will bottom” have already been disproven, as have judgments made in early 2025 that “housing has stabilised.”
So, is it reasonable for some people to use the recent rise in existing-home sales as evidence that the housing market has bottomed? I believe it is too arbitrary to claim a historic turning point has arrived based on a single transaction metric. In fact, many people tend to form a conclusion first and then search for reasons to justify it. Trend analysis requires a broader perspective, like using a telescope; analysing January’s existing-home sales data is akin to using a microscope to identify a historic turning point. Furthermore, the average transaction price for existing homes is very low, mainly reflecting a phase of warming in rigid demand—what I often refer to as “an uphill segment on the way downhill.”
One still needs to look at valuation first, such as the rent-to-price ratio and the price-to-income ratio (though the latter is less accurate). If valuation remains high and rents have not rebounded, the market may still be some distance from the bottom. And an “overshoot” cannot be ruled out—just as equity markets often fall below a perceived “floor.”
In other words, using transaction data to judge trends requires skill. Macro research should rely more on the telescope. For example, a key factor behind China’s economic rise in the 1990s was the demographic dividend, but the “brewing period” for this dividend occurred between 1962 and 1974. After a demographic dividend, there may also be a “demographic debt”—the fiscal burden of pensions will rise sharply, which significantly increases the cost of economic growth.
Detailed transaction-data analysis may pierce illusions and challenge “consensus.”
In November 2024, I wrote “Rethinking the ‘Consensus’ on Capital Markets: Can a Rising Stock Market Really Boost Consumption?” [Check out the English translation on The East is Read], which triggered significant controversy, because most people take it for granted that a rising stock market must boost consumption. However, in 2025, despite the Shanghai Composite Index rising by 18.41% and policymakers introducing a range of consumption-boosting measures, the results were less than satisfactory. For example, the scale of the consumer goods trade-in programme doubled compared to 2024 (the trade-ins primarily focused on durable goods with higher unit prices; based on 2025 sales data, beneficiary participation reached only 360 million). Yet, the growth rate of total retail sales of consumer goods was just 3.7%, nearly identical to 2024’s 3.5%, showing a pattern of stronger growth early in the year and weaker performance later on.
A closer look at the A-share investor structure and transaction data reveals that a larger share of investors tend to hold a relatively small portion of total capital but account for an exceptionally high share of trading value. As a result, after years of investing, loss rates are relatively high. This pattern is not unique to A-shares; it is common across global equity markets.
That article cited data from “Wealth Redistribution in Bubbles and Crashes” (An Li, Lou Dong, & Shi Donghui, 2022, Journal of Monetary Economics). From July 2014 to December 2015, institutional investors on the Shanghai Stock Exchange accounted for 11% of holdings and 12% of trading volume; individual investors accounted for less than 25% of holdings, but nearly 90% of trading volume. During this period, the bottom 85% of individual investors by total wealth lost RMB 250 billion due to active investment strategies, while the top 0.5% of individual investors by total wealth earned RMB 254 billion.
This suggests that frequent trading and insufficient investment knowledge may be the main causes of losses. As noted above, in 2024, stocks below RMB 30 billion in market capitalisation accounted for as much as 63.4% of total A-share trading value, while the comparable figure in the U.S. market was only 7.1%. Yet stocks below RMB 30 billion accounted for only 13.2% of profits, indicating that individual investors, overall, earn very little dividend income from the stocks they trade frequently.
In the West, equity markets also exhibit a “wealth illusion”: many believe they can make money, but in reality, they often gain little and lose more. Starting in 1991, Nobel laureate Robert Shiller and Karl Case studied annual data on total stock market wealth and household consumption across 14 developed countries from 1975 to 1999. They also analysed quarterly consumption data across 50 U.S. states over 17 years. They found that the stock market had no wealth effect—whether stocks rose or fell, consumption barely changed. In contrast, they discovered a significant relationship between real estate price movements and consumption.
Because housing has a dual role—both as consumption and investment—transactions are much less frequent than in stocks, and participation is broader. Over the long term, housing also carries a relatively high probability of land value appreciation. As a result, real estate has a wealth effect: rising housing prices can stimulate consumption and drive up prices.
In summary, transaction data reflect actual events, and there are correlations across different indicators. One can infer broader trends from smaller details and gain insights into smaller phenomena through larger patterns, though it is important to avoid the “blind men and an elephant” problem. It’s similar to how people can use order volumes for specific products in Yiwu’s small commodities market to predict the outcome of a U.S. presidential election.
Furthermore, one can also use principles of cyclicality or symmetry to anticipate future phenomena. For example, when real estate was booming, I predicted that it would later become difficult to sell homes and that household mortgage loans would shift from performing to non-performing.
In the real world, there are many erroneous “consensus” views, as well as many biases and misconceptions. Transaction data can help reveal a relatively more realistic facet of the world. Of course, the world is multifaceted, and transaction data can reflect only one or several facets; it needs to be combined with other data to deepen understanding.
Drawing on Charles Wei-Hsun Fu’s creative hermeneutics of Daoism, I proposed “six dimensions of the stock market”: stock market as economy; stock market as evaluation; stock market as psychology; stock market as function; stock market as casino; and stock market as corporate governance.
Li Xunlei: bull market boosting consumption is bearly grounded

In mainland China’s financial discourse, there’s a widely shared but largely untested belief that a rising stock market can stimulate consumption and help boost domestic demand. The logic is simple: rising stock prices fatten investor portfolios, leading to higher consumer spending, which in turn could reinvigorate economic recovery.
Li Xunlei: one billion people in China have never been on a plane

“One billion people in China have never been on a plane” has become a minor meme to be wheeled out whenever the conversation turns to weak consumption and an economy short of effective demand. It was first put forward in early 2019 by Li Xunlei, one of the most renowned chief economists among major domestic securities firms in China, as a warning that “…
Li Xunlei: Why China’s debt keeps climbing while others’ have eased

Li Xunlei, Chief Economist at Zhongtai Financial International Limited. Li has worked extensively at other Chinese securities banks, including Junan Securities, Guotai Junan Securities, and Haitong Securities. He is one of the most renowned chief economists among major domestic securities firms in China.
 | A guest post by
|