


China’s infrastructure boom has been one of the defining features of its economic transformation. But does its transport infrastructure now exceed what actual demand can support?
We have previously discussed related questions, including whether China has massively overbuilt high-speed rail in our sister newsletter, Pekingnology. In today’s article, Li Xunlei, Chief Economist at Zhongtai Financial International Limited, a leading Chinese investment bank, takes a data-driven look at the broader issue of China’s transport overcapacity.
Li argues that China’s transport infrastructure, including expressways, railways, and urban public transport, has already developed structural overcapacity: in less-developed regions, infrastructure expansion has often exceeded what local populations and economies can support, while the continued expansion of transport networks has been accompanied by lower utilisation, weaker investment returns, and heavier debt burdens. Demographic changes, declining population mobility, and greater population concentration in major cities are only going to widen these mismatches.
The article was originally published on 27 August 2026 on 李迅雷金融与投资 Finance & Investment with Li Xunlei, Li's personal WeChat blog.
Li has kindly reviewed and authorised the translation.
— Yuxuan Jia

被忽视的运能过剩
The Overlooked Transport Overcapacity
As early as 2009, I took an interest in Guizhou Province’s expressway development plan, which projected that the province’s total expressway mileage would reach 6,851 kilometres by 2030. At the time, Japan had the world’s second-largest economy and a total expressway network of 6,300 kilometres, while Guizhou ranked relatively low among Chinese provinces in terms of GDP. If Guizhou’s expressway network was actually going to become longer than Japan’s, would that result in excess expressway capacity in the province? This question led me to write an article titled Expressways: A Road to Prosperity or Desolation?
Seventeen years have now passed. Before 2008, inadequate infrastructure was a major constraint on China’s economic development. Today, China is a global leader in infrastructure. That transformation has helped make China one of the world’s leading manufacturing nations and supported its push to become a manufacturing powerhouse. At the same time, however, structural overcapacity has emerged in some traditional industries, while relatively little academic attention has been paid to the supply-demand balance in road transport infrastructure.
Based on the data collected for this article, my preliminary conclusion is that China’s road transport infrastructure is enormous in scale and technologically advanced, but suffers from structural overcapacity in total network mileage, total passenger capacity, and geographic distribution. For convenience, I will refer to this phenomenon as “transport overcapacity”.
Expressways: Excessive Total Mileage and a Mismatch Between Regional Distribution and Economic Density
By the end of 2025, Guizhou’s total expressway mileage had already reached 9,563 kilometres, far exceeding the target originally set for 2030. Estimates of Japan’s total expressway mileage vary, but according to The Japan Times, it stood at 10,328 kilometres at the end of March 2025. The two were therefore not far apart. Yet in 2025, Japan’s GDP was 13.4 times that of Guizhou.
Nationwide, China’s total expressway mileage reached 199,400 kilometres by the end of 2025, almost twice the 106,000 kilometres in the United States.
Moreover, as the total length of the expressway network continues to expand, traffic intensity has steadily declined. A cross-sectional comparison for 2024 shows that provinces with more expressway mileage did not necessarily have higher freight-use intensity, suggesting that later expansion of the network has increasingly become detached from actual demand.
Guizhou, for example, had about 9,000 kilometres of expressways in 2024, but its freight intensity was only 3.93 billion tonne-kilometres per 10,000 kilometres of expressway, far below Guangdong’s 12.59 billion tonne-kilometres per 10,000 kilometres. Tibet, Hainan, Qinghai, Sichuan, and Yunnan also recorded freight intensity of less than 5 billion tonne-kilometres per 10,000 kilometres.
Mismatch Between Expressway Distribution and Freight Traffic Intensity
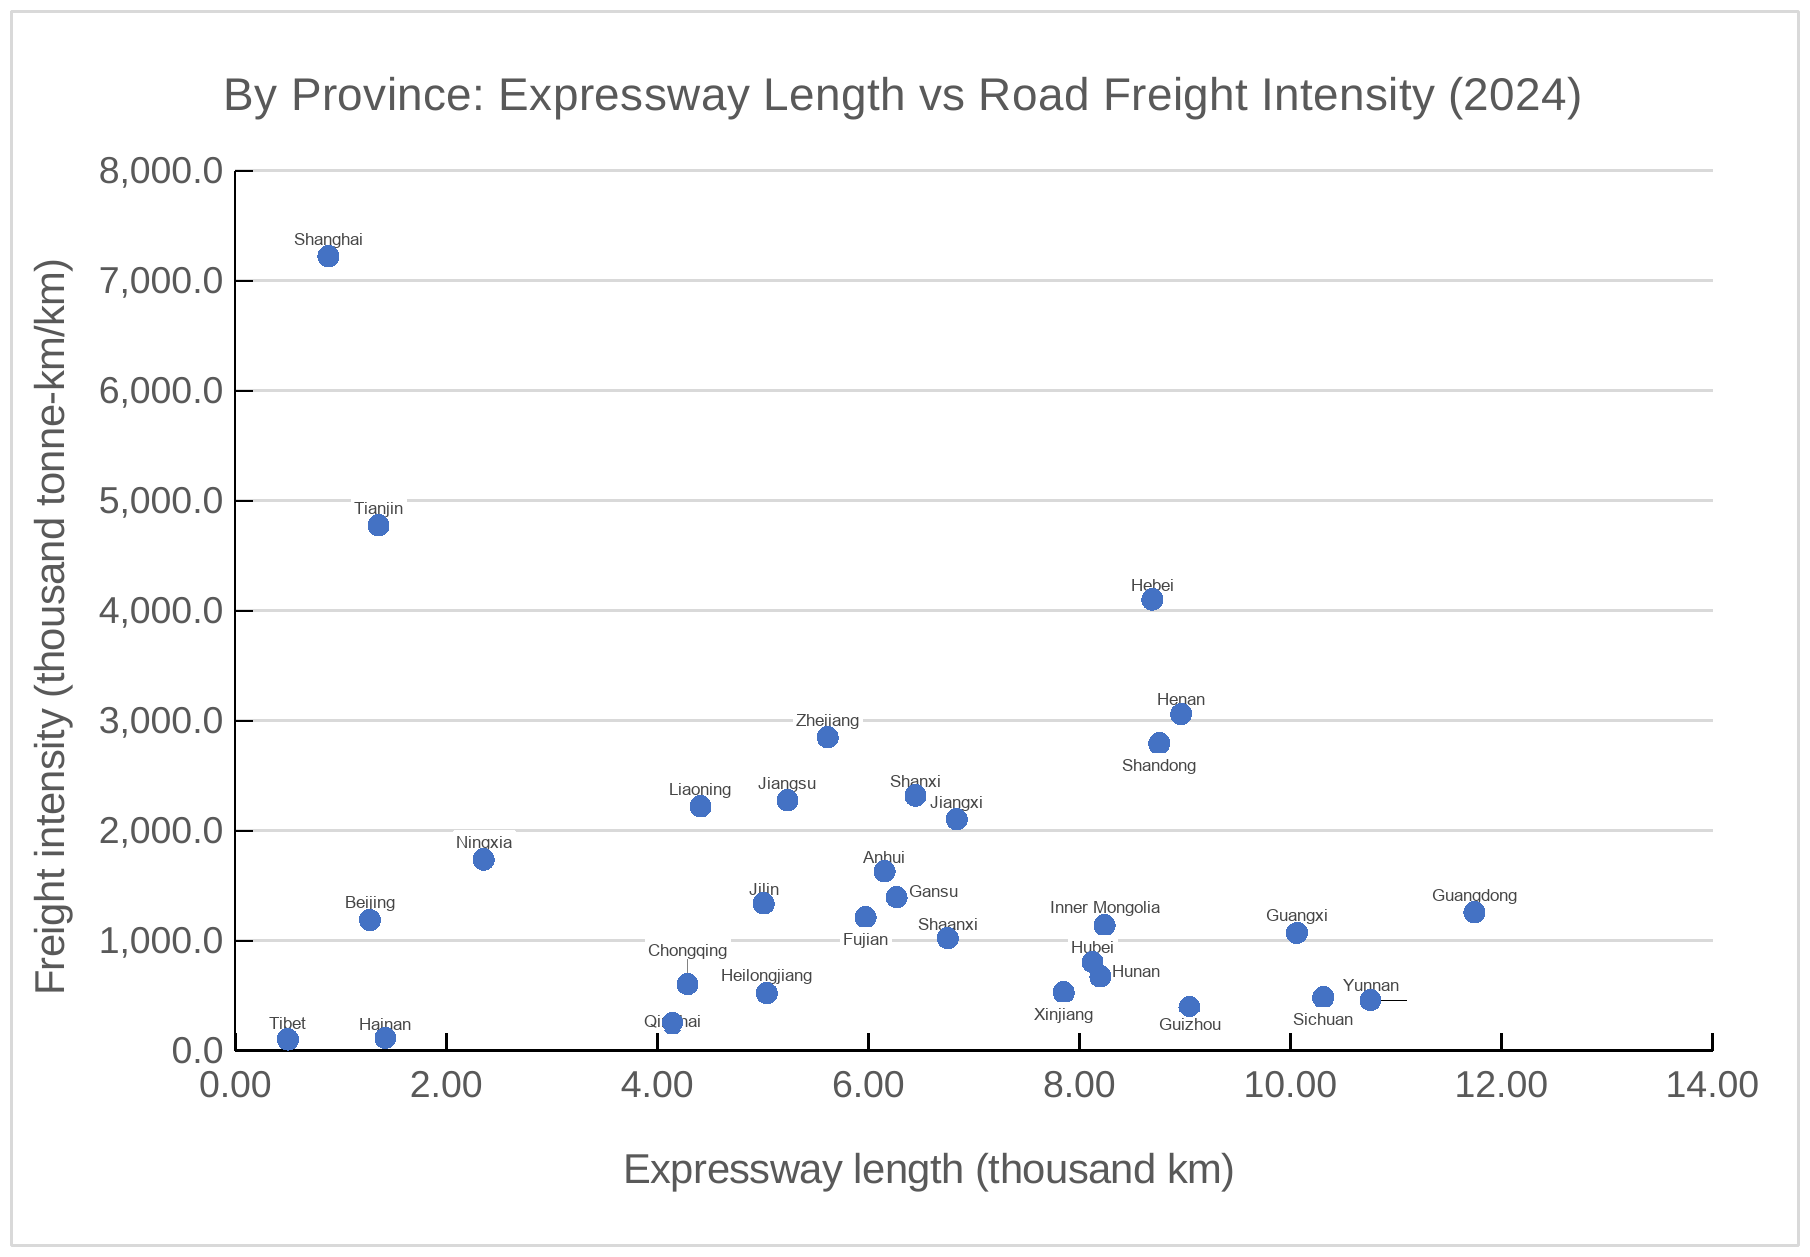
My team calculated the compound annual growth rates of expressway mileage and road freight turnover between 2014 and 2024. In the five provincial-level regions where expressway mileage grew fastest — Tibet, Yunnan, Guangxi, Qinghai, and Guizhou — mileage grew by at least 8.48% year on year, while road freight turnover increased by only 1.8% on average.
By contrast, in the five regions where expressway mileage expanded most slowly, road freight turnover grew by an average of 4.8% a year. In Shanghai, for example, expressway mileage increased by only 0.7% annually, while freight turnover rose by as much as 12.1%. In Zhejiang, expressway mileage grew by 3.75% a year, while freight turnover increased by 9.32%.
The conclusion is clear: the places that built the most expressways were often those where freight demand grew the least.
The same issue can be seen in road passenger transport. Since China’s total passenger traffic had already peaked in 2012, the continued expansion of the road network meant that the passenger traffic carried by each kilometre of road would decline. Passenger intensity fell from a peak of 436,000 passenger-kilometres per kilometre of road in 2012 to just 91,000.
Road Traffic Intensity in China
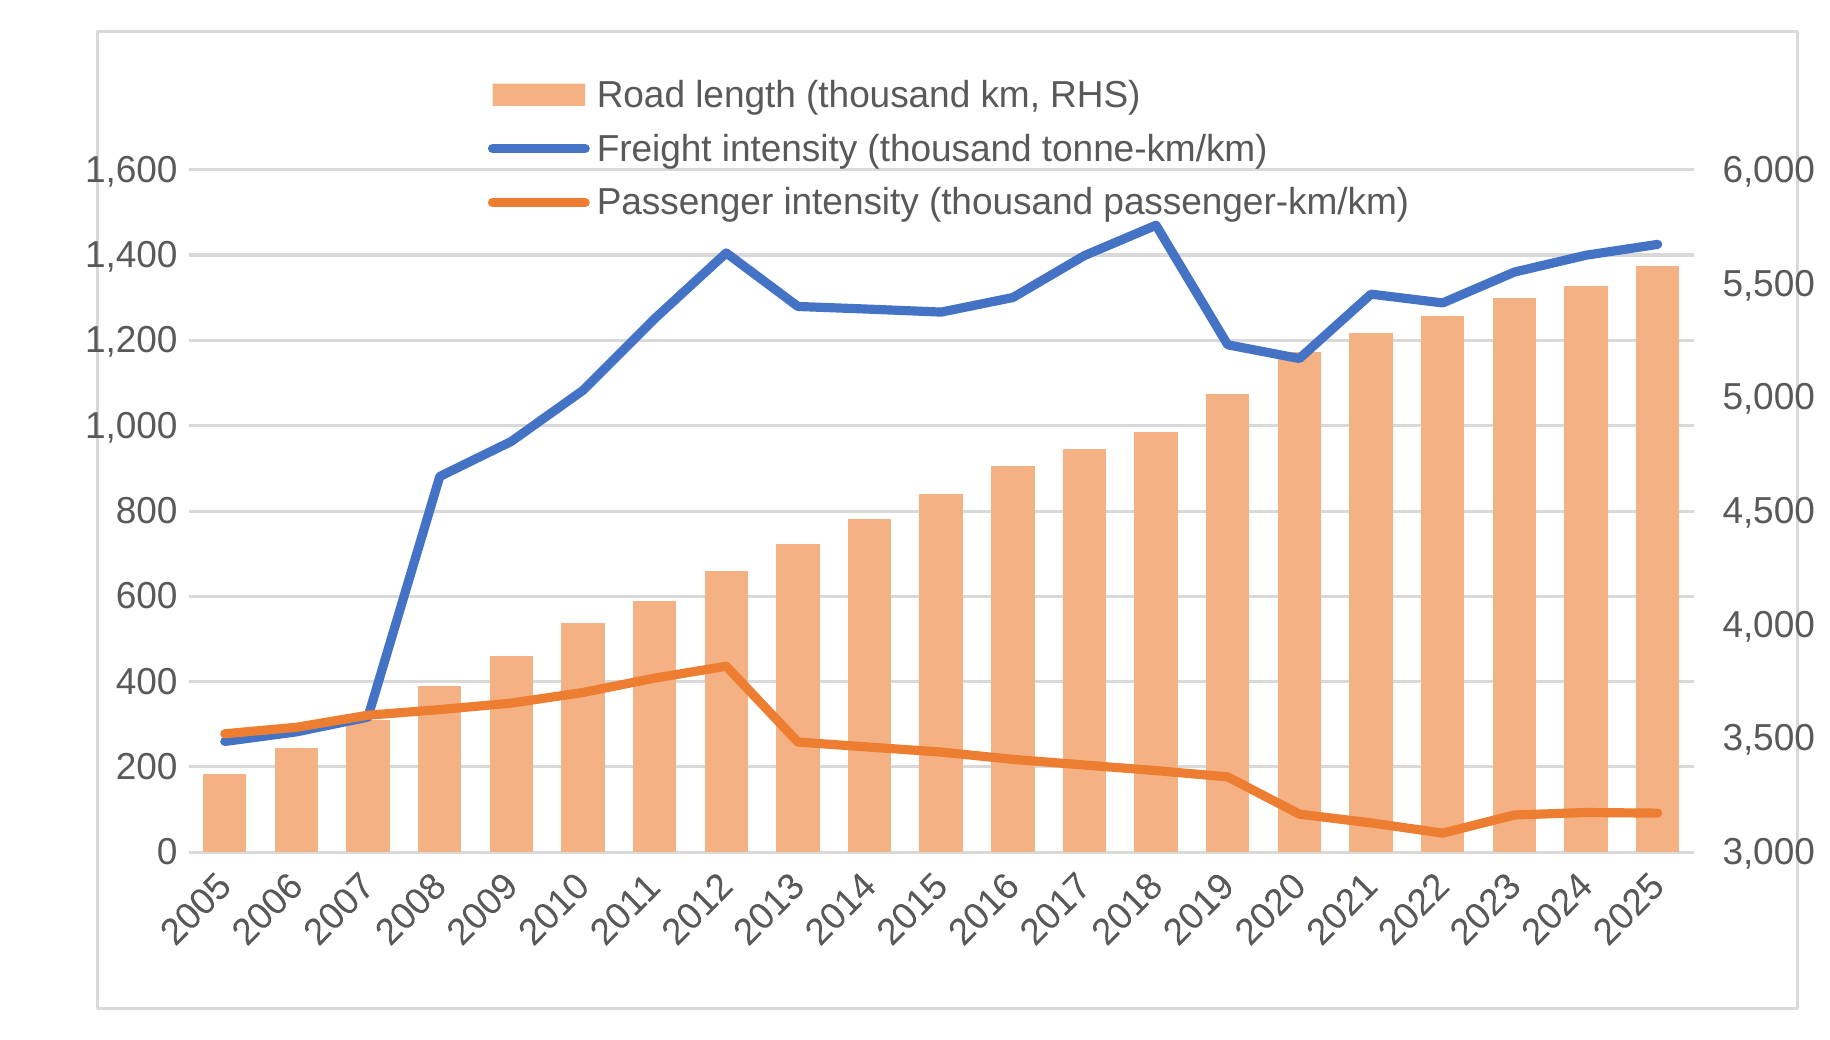
Of course, these figures do not include journeys made by private car. China’s vehicle stock has risen sharply over the past two decades, driven mainly by growth in private car ownership. Yet even with China leading the world in annual automobile sales, vehicle use per kilometre of expressway remains relatively low.
Motor Vehicles per Kilometre of Expressway in Major Countries, 2025
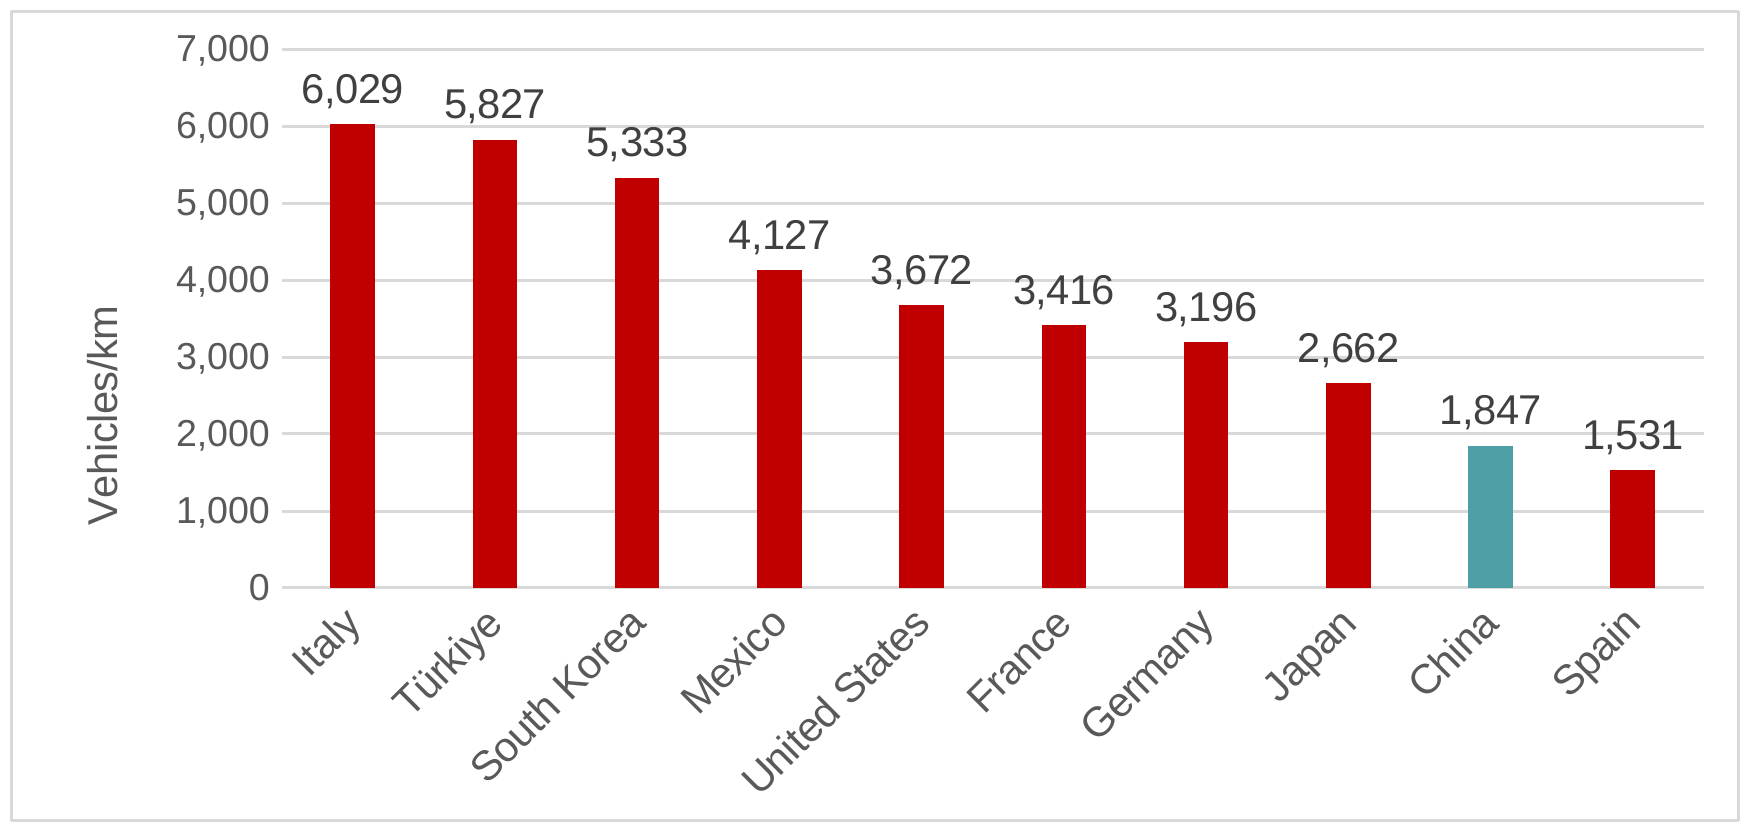
Based on 2025 data, China had 1,847 motor vehicles for every kilometre of expressway, compared with 3,672 in the United States, 2,662 in Japan, 5,333 in South Korea, and 3,416 in France. Clearly, the density of vehicles per kilometre of expressway in China was lower than in all of these countries.
China’s vehicle stock has grown rapidly in recent years, but growth in automobile sales slowed sharply in 2026, while total expressway mileage continued to increase quickly. At the same time, vehicle density is much higher on expressways in the more developed eastern regions. This points to a dual structural imbalance: some areas face capacity shortages, while others have overcapacity. In aggregate, however, expressway capacity remains excessive.
Building roads and bridges and digging tunnels can undoubtedly support economic development and improve people’s lives. The key question is whether the input-output ratio is reasonable.
Because expressway construction has largely been financed through borrowing, the financial position of toll roads is particularly important. According to the National Toll Road Statistical Bulletin 2021, toll-road revenue nationwide totalled RMB 663.1 billion in 2021, while total expenditure reached RMB 1.2909 trillion, leaving a shortfall of RMB 627.9 billion. (The shortfall reached a record RMB 747.8 billion in 2020, compared with RMB 485.0 billion in 2019.)
Of total expenditure, RMB 1.0592 trillion went towards principal and interest payments on debt, RMB 73.9 billion towards maintenance, RMB 30.7 billion towards the expansion and upgrading of roads and auxiliary facilities, RMB 83.9 billion towards operations and management, and RMB 43.3 billion towards taxes and fees. These accounted for 82%, 5.7%, 2.4%, 6.5% and 3.4% of the total, respectively. In other words, a full year of toll revenue was not even enough to cover principal and interest payments on debt.
Since the Ministry of Transport stopped publishing toll-road statistics after 2021, it is difficult to conduct further analysis. However, fragmentary data released in recent years suggest that road-toll revenue has stopped rising. One possible reason is that expressways built towards the end of the last century are gradually approaching the end of their 30-year tolling periods, meaning that a wave of expressways becoming toll-free may have arrived.
Although some expressway sections may be able to extend their tolling periods through expansion and reconstruction projects, doing so inevitably adds to investment costs.
At the same time, expressways built earlier were generally on routes with stronger transport demand and heavier traffic, while those built later tend to carry less traffic. This suggests diminishing returns on investment in toll roads.
One indication is the median return on invested capital (ROIC) of local government financing vehicles, which fell from 3.1% in 2011 to 1.3% in 2020. This may also help explain why private companies now account for an increasingly small share of investment in expressway projects.
Railways: Structural Overcapacity
Between 2015 and 2025, China’s railway network expanded from 121,000 to 165,000 kilometres. Yet freight turnover per 10,000 kilometres of railway fell by about 45% from its 2010 peak and has remained broadly flat ever since, while passenger traffic intensity is still below its 2019 level.
Rail Traffic Intensity: Passenger and Freight Turnover per 1,000 km of Railway
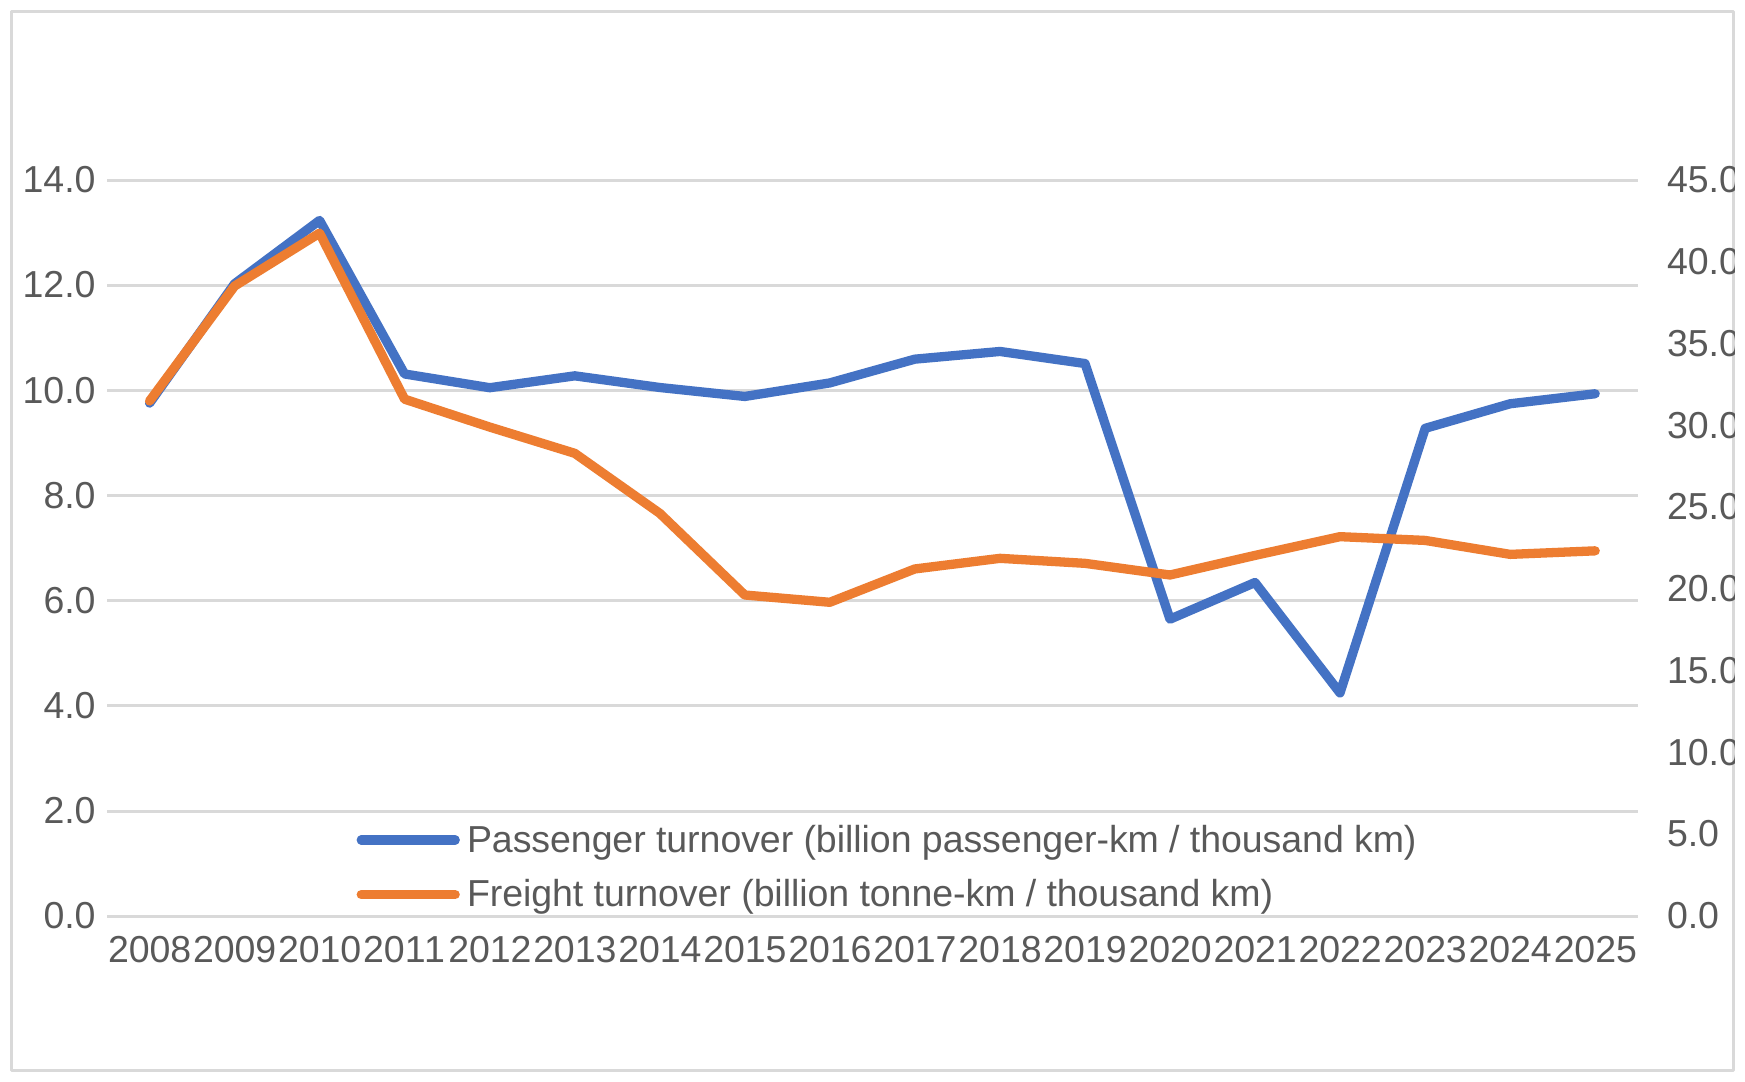
Rail freight volumes have been sustained largely by coal shipments shifted from road to rail, while the average rail freight distance fell steadily from 825 kilometres in 2017 to 693 kilometres in 2024, pointing to a structural decline in demand for long-distance freight transport.
Freight Mix and Average Haul on China’s National Railways, 1990–2024
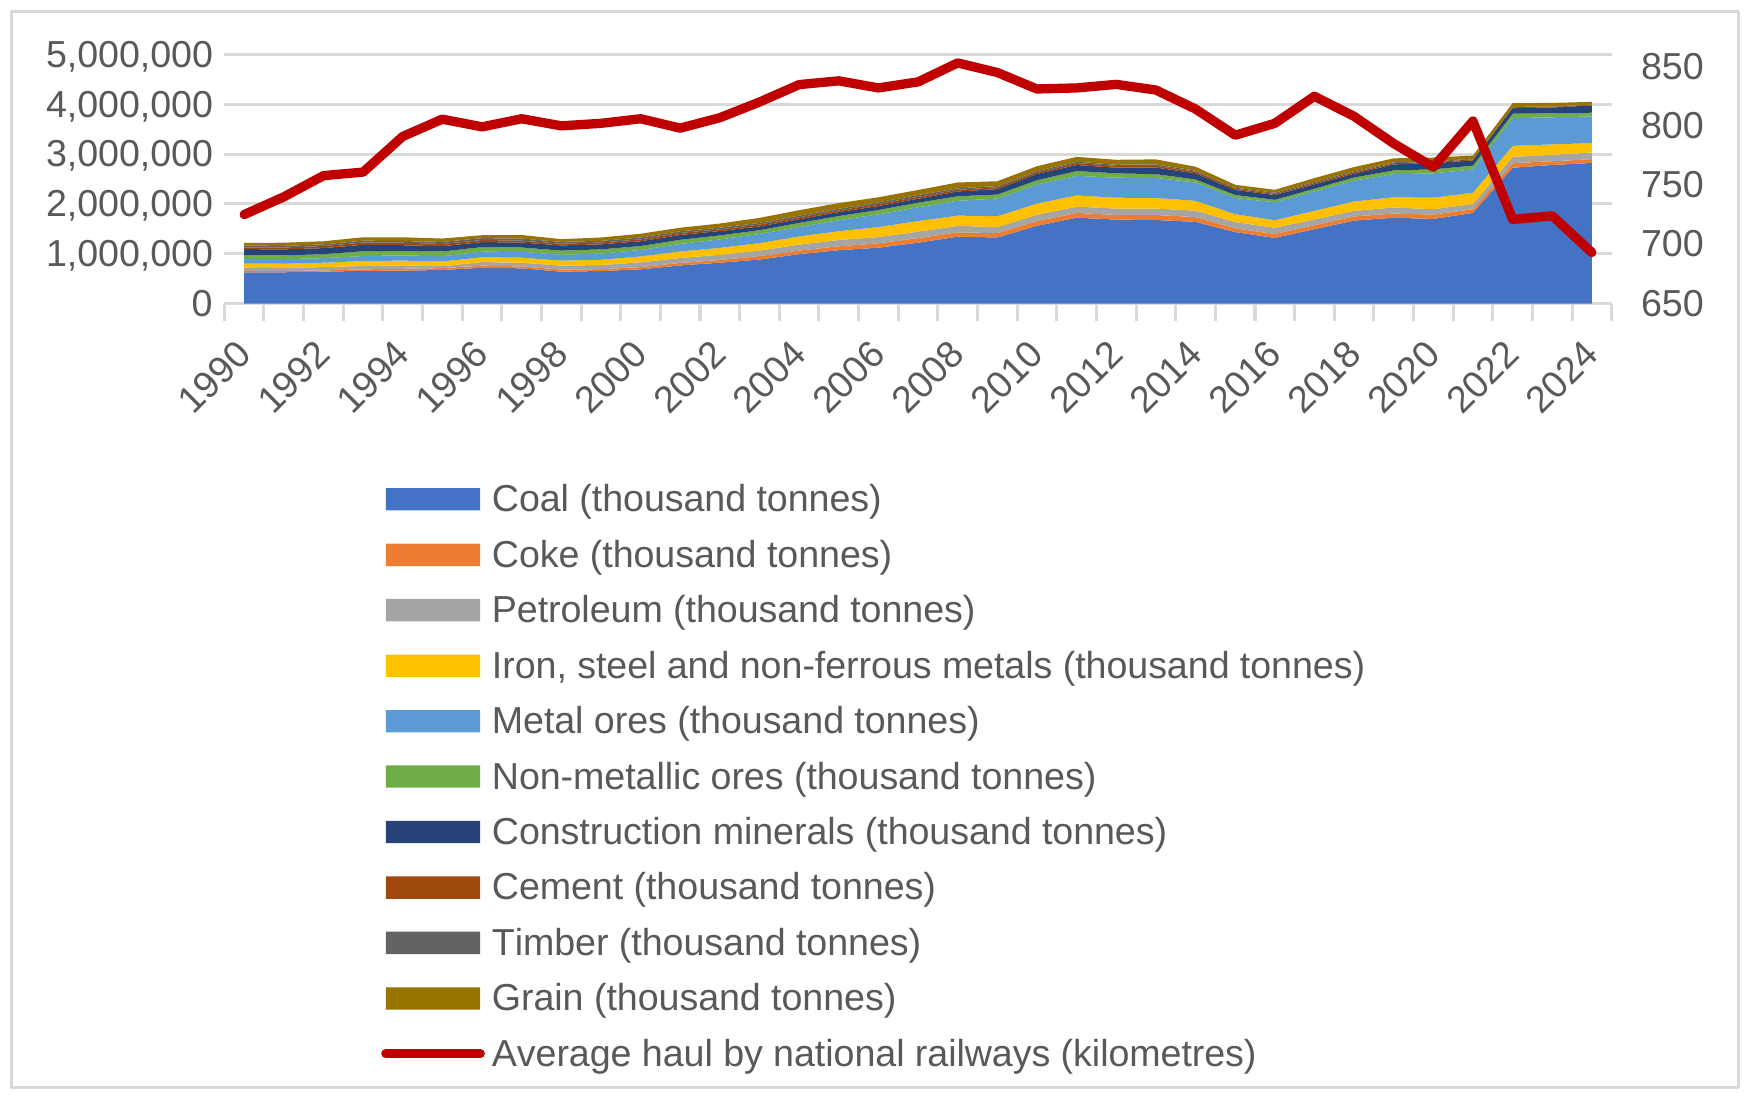
Growth in rail freight has been highly concentrated in resource-export corridors in Xinjiang, Tibet, and Gansu, while freight volumes in a number of eastern and northeastern provinces have declined. National aggregate figures therefore conceal considerable regional underutilisation. Between 2019 and 2024, rail passenger volumes fell in all three northeastern provinces.
China’s development of high-speed rail over the past two decades has been a remarkable achievement. By the end of 2025, China had 50,400 kilometres of high-speed rail in operation, accounting for more than 70% of the world’s total operating high-speed rail mileage of 58,800 kilometres. China’s target for 2030 is 60,000 kilometres.
China’s new high-speed rail mileage peaked in 2014, then declined for several years before recovering in 2018–2019. After the COVID-19 pandemic ended in 2022, marginal passenger intensity also rebounded sharply — that is, the additional transport demand generated by each additional 10,000 kilometres of railway.
New High-Speed Rail Openings and Marginal Passenger-Traffic Intensity: Five-Year Rolling Calculation
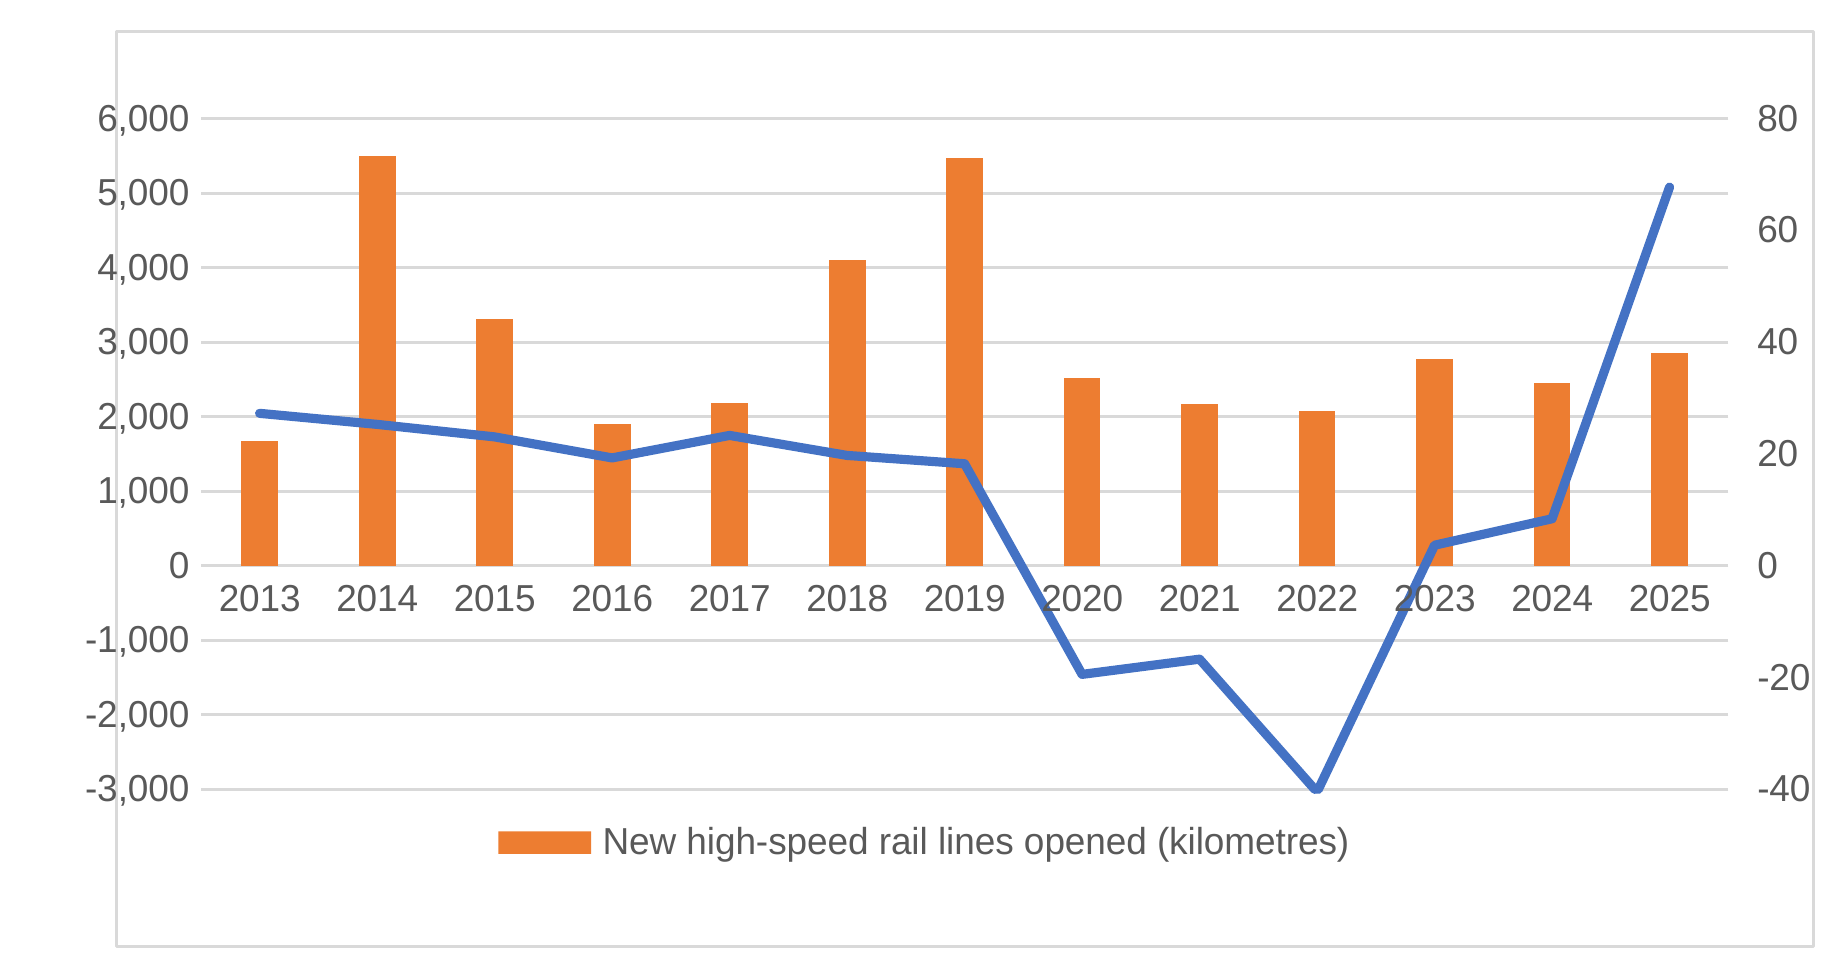
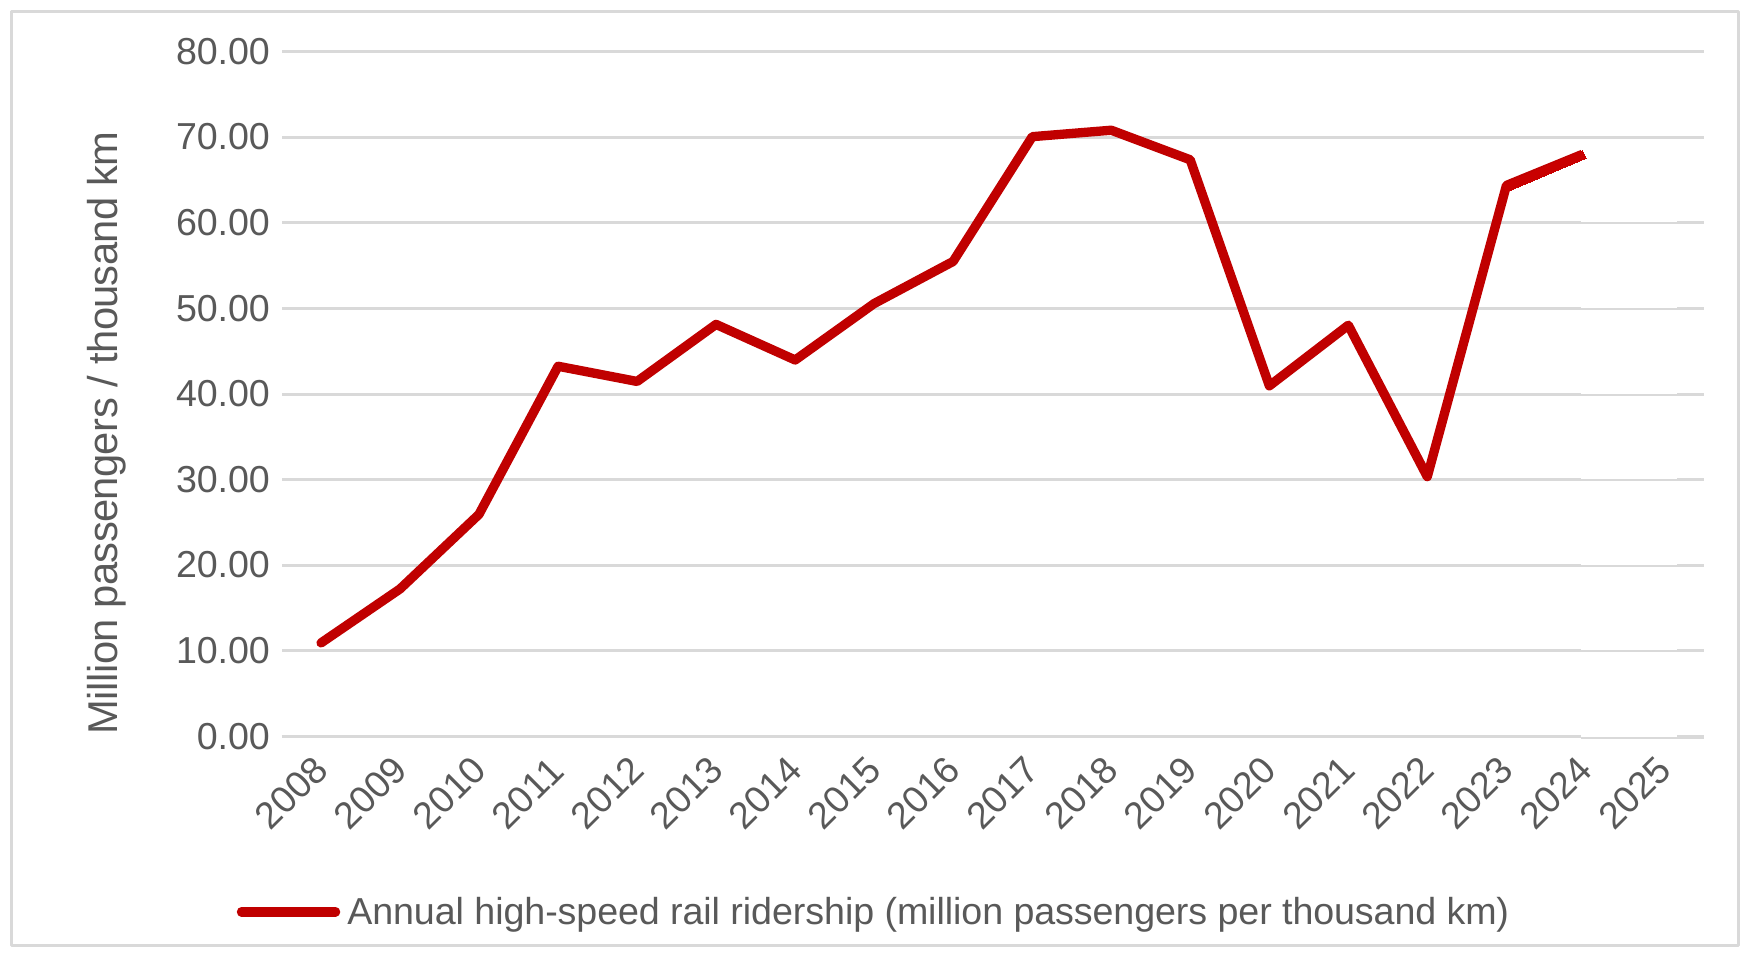
However, publicly available data show that passenger volume per unit of high-speed rail mileage had already peaked in 2018, at 708 million trips per 10,000 kilometres. In 2024, the figure stood at 682 million, still below its pre-pandemic level.
Thus, although the total length of the high-speed rail network increased by 65% between 2018 and 2024, passenger volume per kilometre had still not returned to its 2018 peak. Moreover, in regions experiencing population outflows, the passenger base for high-speed rail services is shrinking.
Annual High-Speed Rail Ridership per 1,000 km of Network
High-speed rail has undoubtedly made travel much more convenient and significantly shortened journey times. But the enormous cost of building high-speed rail and the debt burden it has created cannot be ignored.
By the end of 2025, China State Railway Group had total outstanding debt of RMB 6.17 trillion, of which RMB 5.04 trillion was interest-bearing debt.
Looking ahead, China’s total population is declining, and its migrant population has been falling since 2014. Yet the high-speed rail network continues to expand. It therefore remains highly uncertain whether the railway sector will be able to bring its borrowing levels down on a sustained basis.
Civil Aviation: Feeling the Impact of High-Speed Rail
I once wrote an article titled One Billion in China Have Never Been on a Plane. Many readers took it to mean that I was optimistic about China’s aviation industry. In fact, without such rapid expansion of high-speed rail, air passenger throughput would probably have grown much faster.
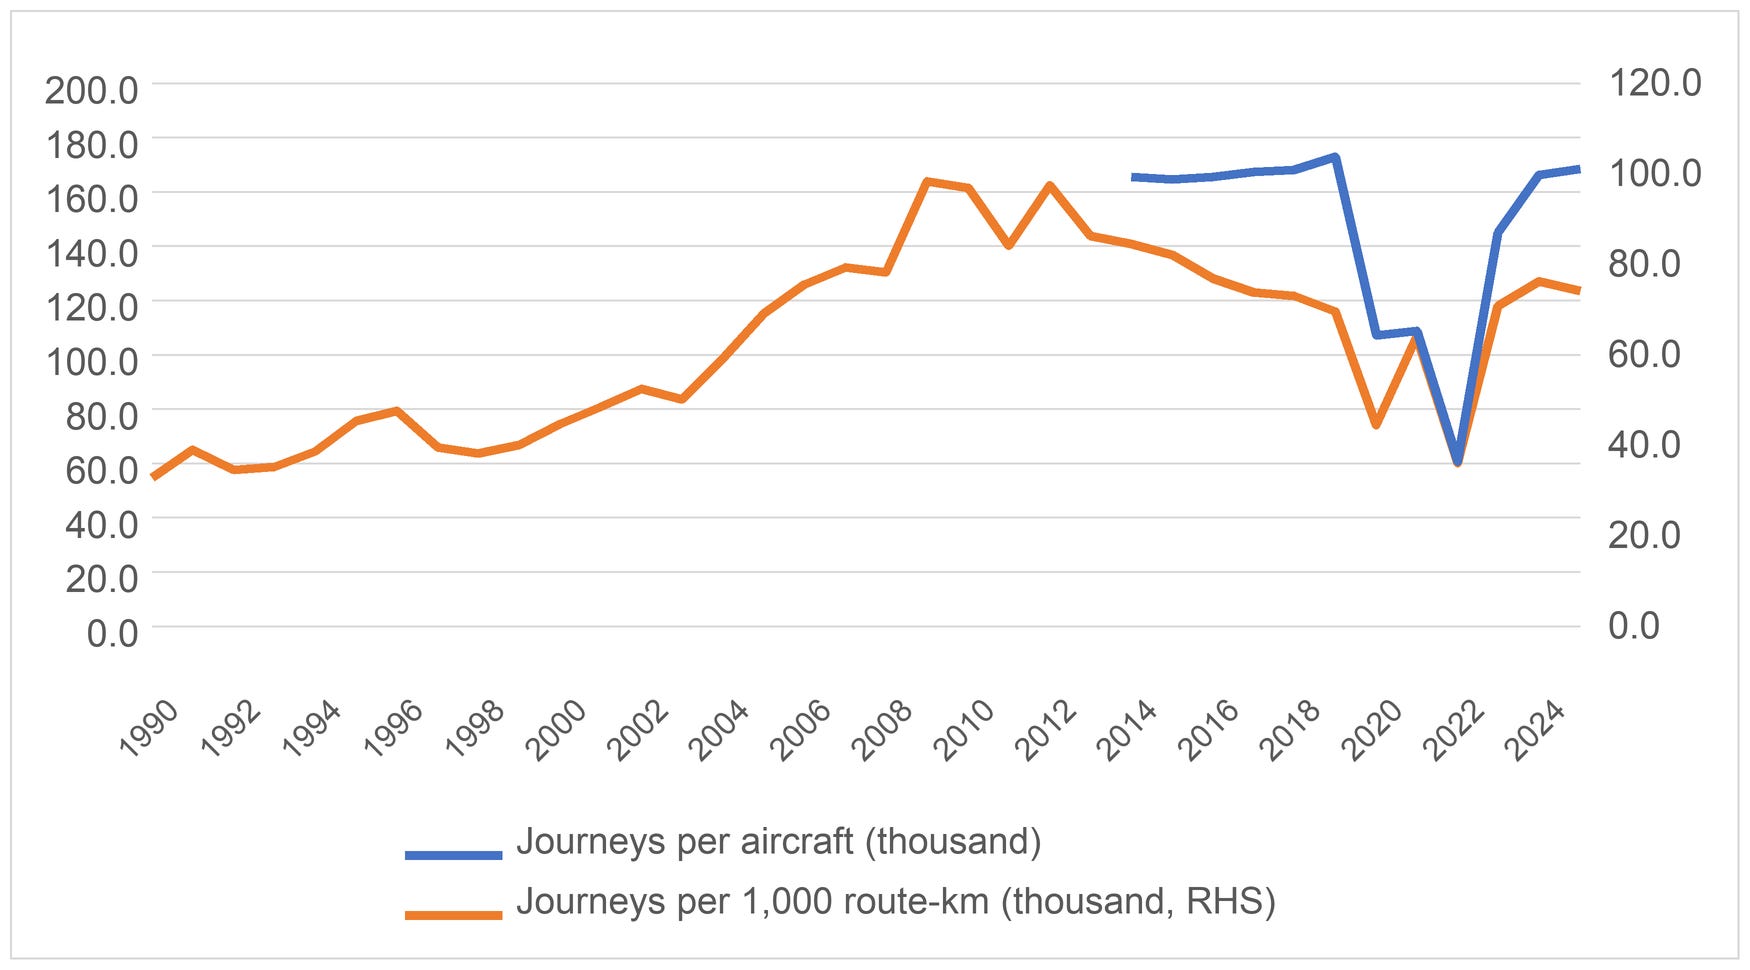
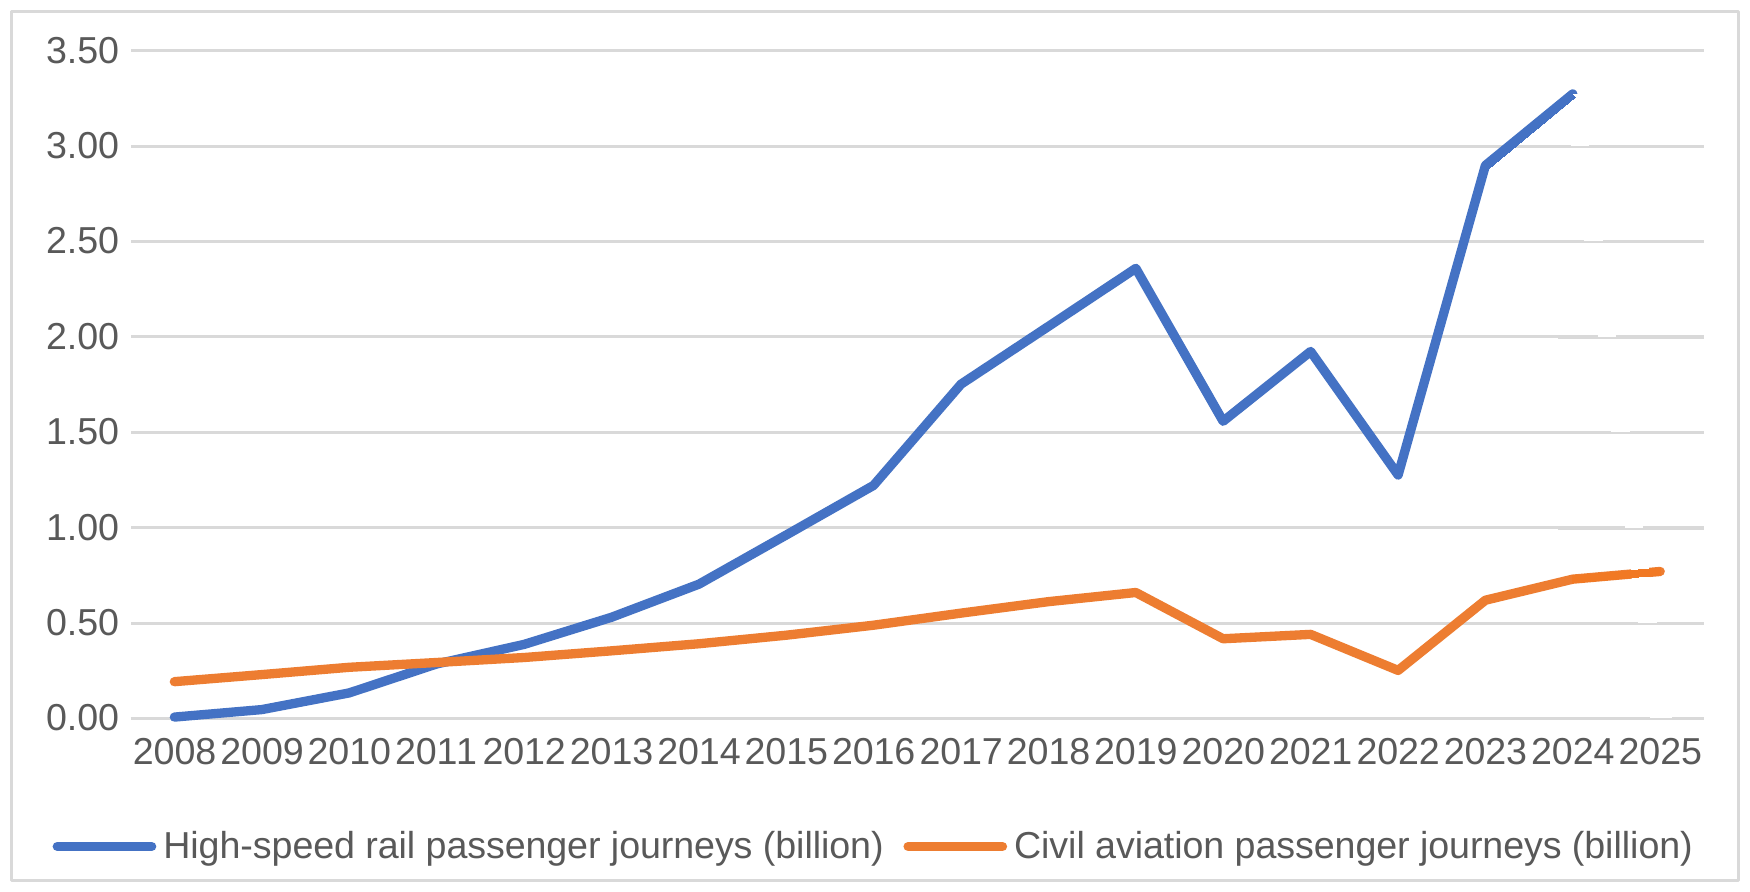
The year 2008 marked the beginning of China’s high-speed rail era. The data show that high-speed rail has significantly diverted passengers away from civil aviation. For example, annual passenger traffic per 10,000 kilometres of air routes peaked in 2009 and has been declining ever since.
Moreover, the air-route network has expanded faster than air passenger traffic. By 2024, annual passenger volume per aircraft was still below its 2019 level, while high-speed rail was carrying 4.5 times as many passengers as civil aviation, with the gap continuing to widen.
Passenger Traffic per Aircraft and per 1,000 km of Air Routes
China’s civil aviation industry should therefore fully factor in the impact of high-speed rail, expressways, and emerging forms of transport such as autonomous vehicles when planning airport construction, route development, and aircraft procurement.
Passenger Volume Gap Widens: High-Speed Rail versus Civil Aviation
According to the 2025 Statistical Bulletin on the Production of Civil Transport Airports issued by the Civil Aviation Administration of China, China had 270 certified transport airports by the end of 2025. Of these, 41 handled more than 10 million passengers a year, and together they accounted for 83.7% of total passenger throughput. In other words, more than 85% of the country’s airports shared less than 16% of total traffic. At the bottom of the distribution, some small airports handled almost no passengers, and most were under financial pressure.
Airport passenger traffic is also becoming increasingly polarised. Airports in Beijing, Shanghai, and Guangzhou together accounted for 22.4% of national passenger throughput, up 0.7 percentage points from 2024.
Meanwhile, 191 airports handled fewer than 2 million passengers a year, five more than in 2024, and together accounted for only 5.9% of total passenger traffic, an even smaller share than in the previous year.
For example, Terminal 1 at one airport handled more than 10 million passengers in 2019, but only 8.03 million in 2025, and the figure may be even lower in 2026.
Why did passenger throughput fall rather than rise over those six years? This was probably related to the opening of several high-speed rail lines serving the same city, with still more such lines being added.
Terminal 2 at the same airport, begun in 2020 and opened in 2024, was designed for 23 million passengers a year. Its opening took Terminal 1 — in service only since 2015 — out of passenger use after just nine years, with plans to convert it into office space. That is a great pity.
Therefore, infrastructure investment, including airport construction, needs to be much more forward-looking, taking into account future population trends and the development and geographic distribution of high-speed railways, expressways, and other transport infrastructure.
China is seeing an increasing concentration of population in major cities. Tier-three, tier-four, and tier-five cities are generally experiencing net population outflows, as are the three northeastern provinces, Shandong, Hebei, and much of central and western China. Against this backdrop, declining passenger throughput at most airports is inevitable.
Buses and Metros: Overall Overcapacity and Structural Imbalances
I once came across a Shanghai television report in which public transport staff said that buses in Lujiazui Financial City carried an average of just 1.5 passengers each between 8 a.m. and 2 p.m.
The decline in bus ridership is probably related to the rapid development of metro systems and the growing popularity of private cars, ride-hailing services, and shared bicycles.
Nationwide, annual passenger volume per bus fell to just 33% of its 2010 level by 2025. Passenger volume per kilometre of bus-route network declined even more sharply, to only 16% of its 2010 level, despite continued growth in both the bus fleet and route network.
Bus Ridership per Vehicle and per Kilometre of Route Network (Indexing 2010 Level at 100)
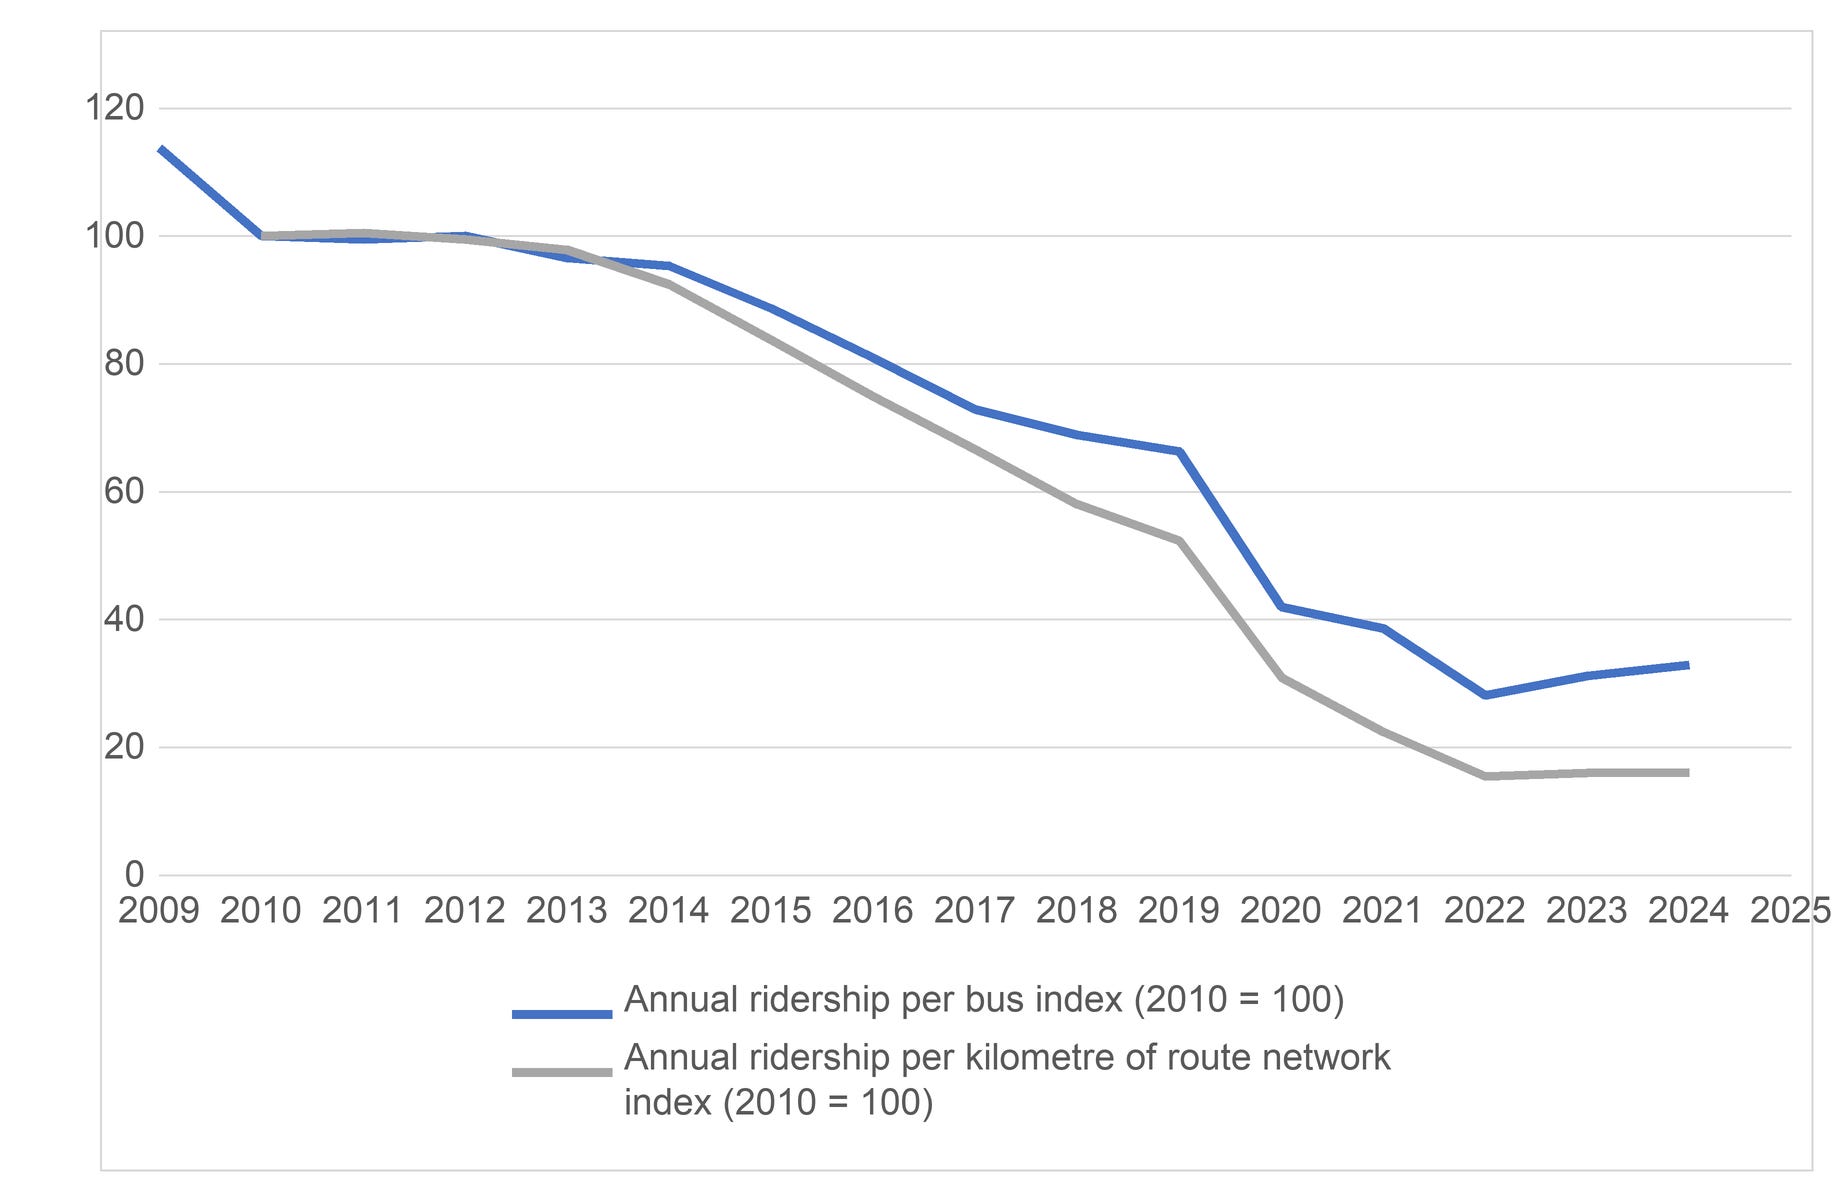
Passenger volume per bus has fallen by between 40% and 75% in all 31 provincial-level regions, showing that the problem is nationwide rather than confined to a handful of cities.
In Hebei, Henan, and some other provinces, passenger volume per bus has fallen by more than 70%. Yet the overall size of the bus fleet does not appear to have been reduced substantially. At the same time, environmental requirements have led to the replacement of fuel-powered buses with electric ones.
As of June 2026, China had 11,813 kilometres of urban rail transit in operation, including 10,224 kilometres of metro lines, equivalent to 45% of the world’s total operating metro mileage of 22,790 kilometres.
China, however, accounts for only about 17.5% of the world’s population, and that share is likely to decline further.
According to the Urban Rail Transit 2025 Statistics and Analysis Report released by the China Association of Metros, 58 Chinese cities had urban rail transit systems in operation by the end of 2025, with 382 lines covering more than 13,000 kilometres after a net increase of over 900 kilometres during the year. Metro lines alone exceeded 10,000 kilometres, the highest total in the world.
Under Ministry of Transport requirements, proposed metro and light-rail lines should have an initial passenger intensity of at least 7,000 and 4,000 passenger trips per route-kilometre per day, respectively, and projected peak-hour flows in the busiest direction of at least 30,000 and 10,000 passengers, respectively.
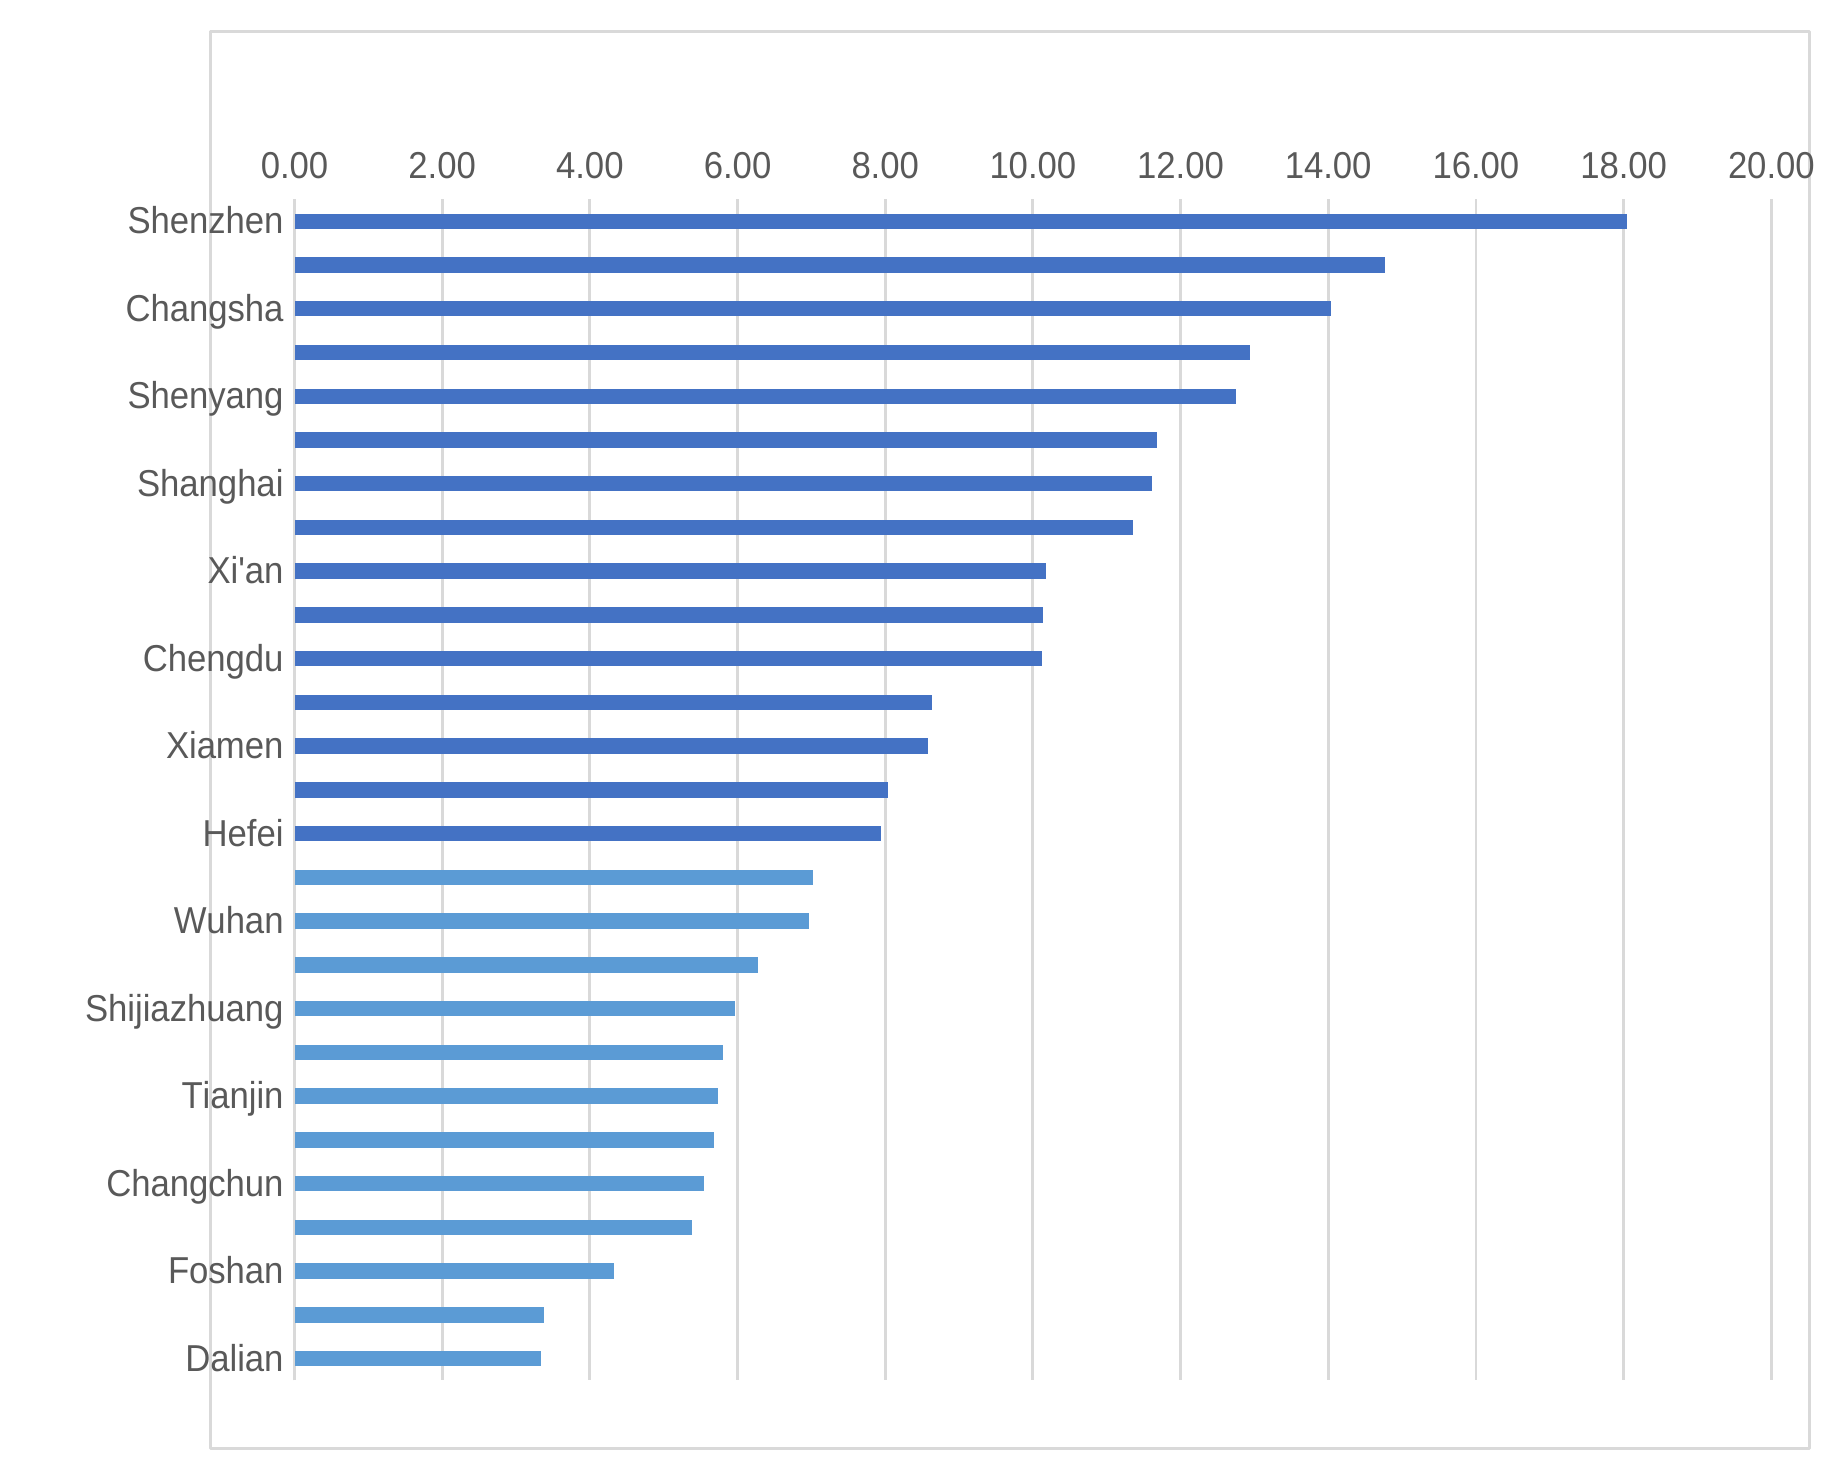
Actual passenger intensity, however, remains relatively low. Of the 41 cities with metro systems, only 27 had disclosed passenger-intensity data as of 15 August 2026, and just 15 met the 7,000-passenger benchmark. On this basis, more than half of the cities with metro systems are estimated to fall below the threshold. Across all 58 cities with urban rail transit, average passenger intensity was only 5,800 trips per kilometre in 2025, down 5.57% from 2024.
Average Daily Metro Ridership per Kilometre, Last 30 Days (Thousand Passenger Journeys per Kilometre of Metro Network)
Metro construction is expensive. Core lines in China’s first-tier cities generally cost more than RMB 1 billion per kilometre, while those involving difficult geological conditions or high relocation costs can exceed RMB 1.5–2.0 billion per kilometre.
For example, metro construction currently costs about RMB 2 billion per kilometre in Shanghai and close to RMB 1 billion in Guangzhou, compared with a more typical RMB 500–800 million in other cities.
Annual operating and maintenance costs are also high, at around RMB 10–15 million per kilometre. This places a heavy fiscal burden on local governments. In 2024, for example, the Beijing government provided RMB 24.852 billion in subsidies for its metro system, while Qingdao, Ningbo, Chengdu, Shenzhen, and several other cities also received more than RMB 7 billion in government subsidies.
In 2025, 3,125.28 kilometres of high-capacity urban rail systems, mainly metros, were under construction, along with 1,620.28 kilometres of medium-capacity systems, including light rail, suburban rapid rail and maglev lines. China’s urban rail capacity is therefore set to expand substantially in the years ahead, even as its total population declines and migration from tier-three, tier-four, and tier-five cities towards larger tier-one and tier-two cities accelerates.
The Causes of Transport Overcapacity and Possible Responses
After examining overcapacity across roads, railways, aviation, and urban public transport, a natural question arises: why has transport overcapacity become so widespread across China’s provinces and cities? And why do many local governments continue launching major construction projects despite already facing considerable debt pressure?
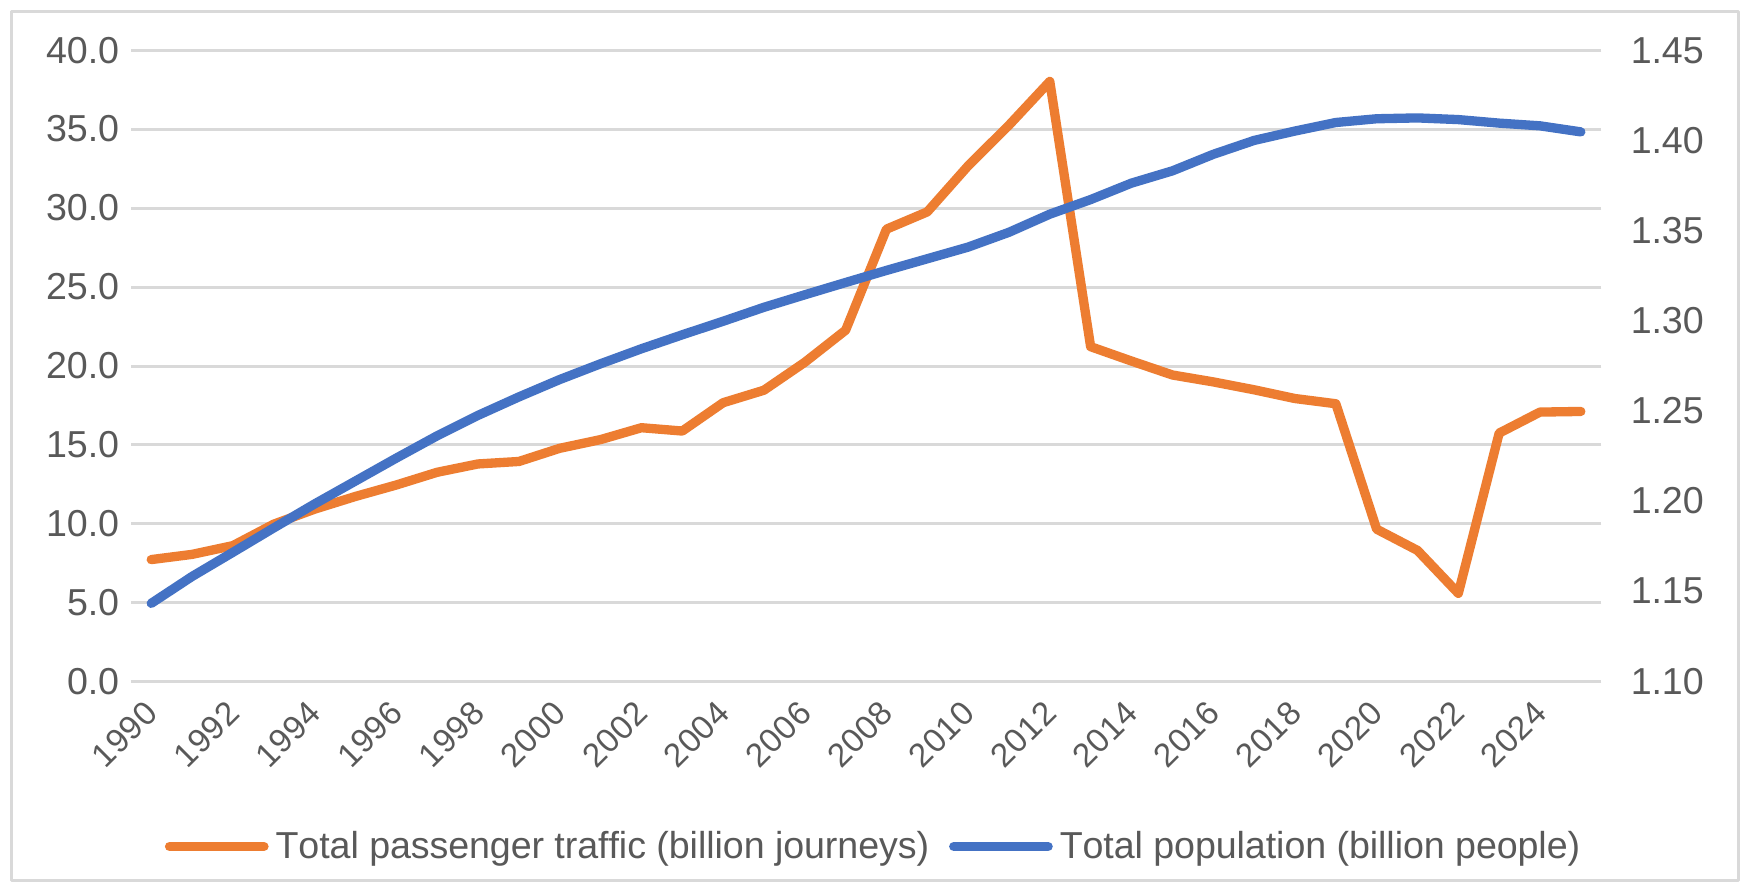
According to data from the National Bureau of Statistics, total passenger traffic peaked as early as 2012 at 38.1 billion trips (excluding passengers travelling in private cars) and has been declining ever since.
China’s migrant population, meanwhile, peaked at about 253 million in 2014 before beginning to decline. Although the Seventh National Population Census recorded a sharp rise to 376 million in 2020, this reflected a change in statistical coverage rather than a genuine reversal of the trend.
In other words, passenger transport demand reached its ceiling roughly a decade before China’s total population peaked in 2021. Yet transport infrastructure investment has continued, with the actual construction and commissioning of high-speed railways, expressways, metros and other facilities often far exceeding earlier plans.
Total Passenger Traffic Peaked Before the Population Did
Why, then, do local governments remain so enthusiastic about infrastructure investment? There are several possible reasons.
First, there is the long-standing belief that “if you want to get rich, build roads first”. Faster and more convenient transport can undoubtedly support economic development, but greater mobility of people and other local economic resources can affect different regions in very different ways.
In previous research, for example, my team examined population changes in cities along the Beijing–Shanghai High-Speed Railway and found that net population outflows accelerated after the line opened. A similar pattern emerged in Japan after the Shinkansen linked Osaka more closely with Tokyo, with more people moving from Osaka to Tokyo.
Second, road and bridge construction has become an important tool for many localities seeking to boost economic growth. Investment can lift GDP quickly, but transport infrastructure often delivers relatively low returns. As a result, fiscal spending can rise much faster than revenue, adding to debt pressure over time. By our calculations, China’s outstanding government debt has grown at more than three times the rate of real GDP over the past five years.
Third, some local officials still place too much emphasis on highly visible infrastructure projects as a measure of their performance, while paying too little attention to underlying problems such as population outflows and weak local industries. This adds further strain to local government finances.
So how should China respond as transport overcapacity becomes increasingly severe in the years ahead?
In a recent article titled Where Is China’s Population Heading? (2026 Edition), my team projected that China’s population could fall below 1.3 billion in 2039 and below 1.2 billion in 2047. We also forecast that China could become a super-aged society by 2031, with people aged 65 and above accounting for more than 20% of the population, further reducing population mobility.
At the same time, the population are likely to become more concentrated in the major cities of the Yangtze River Delta and Pearl River Delta and, in western China, around Chengdu.
Number of Cities Recording Net Population Inflows and Outflows, 2025
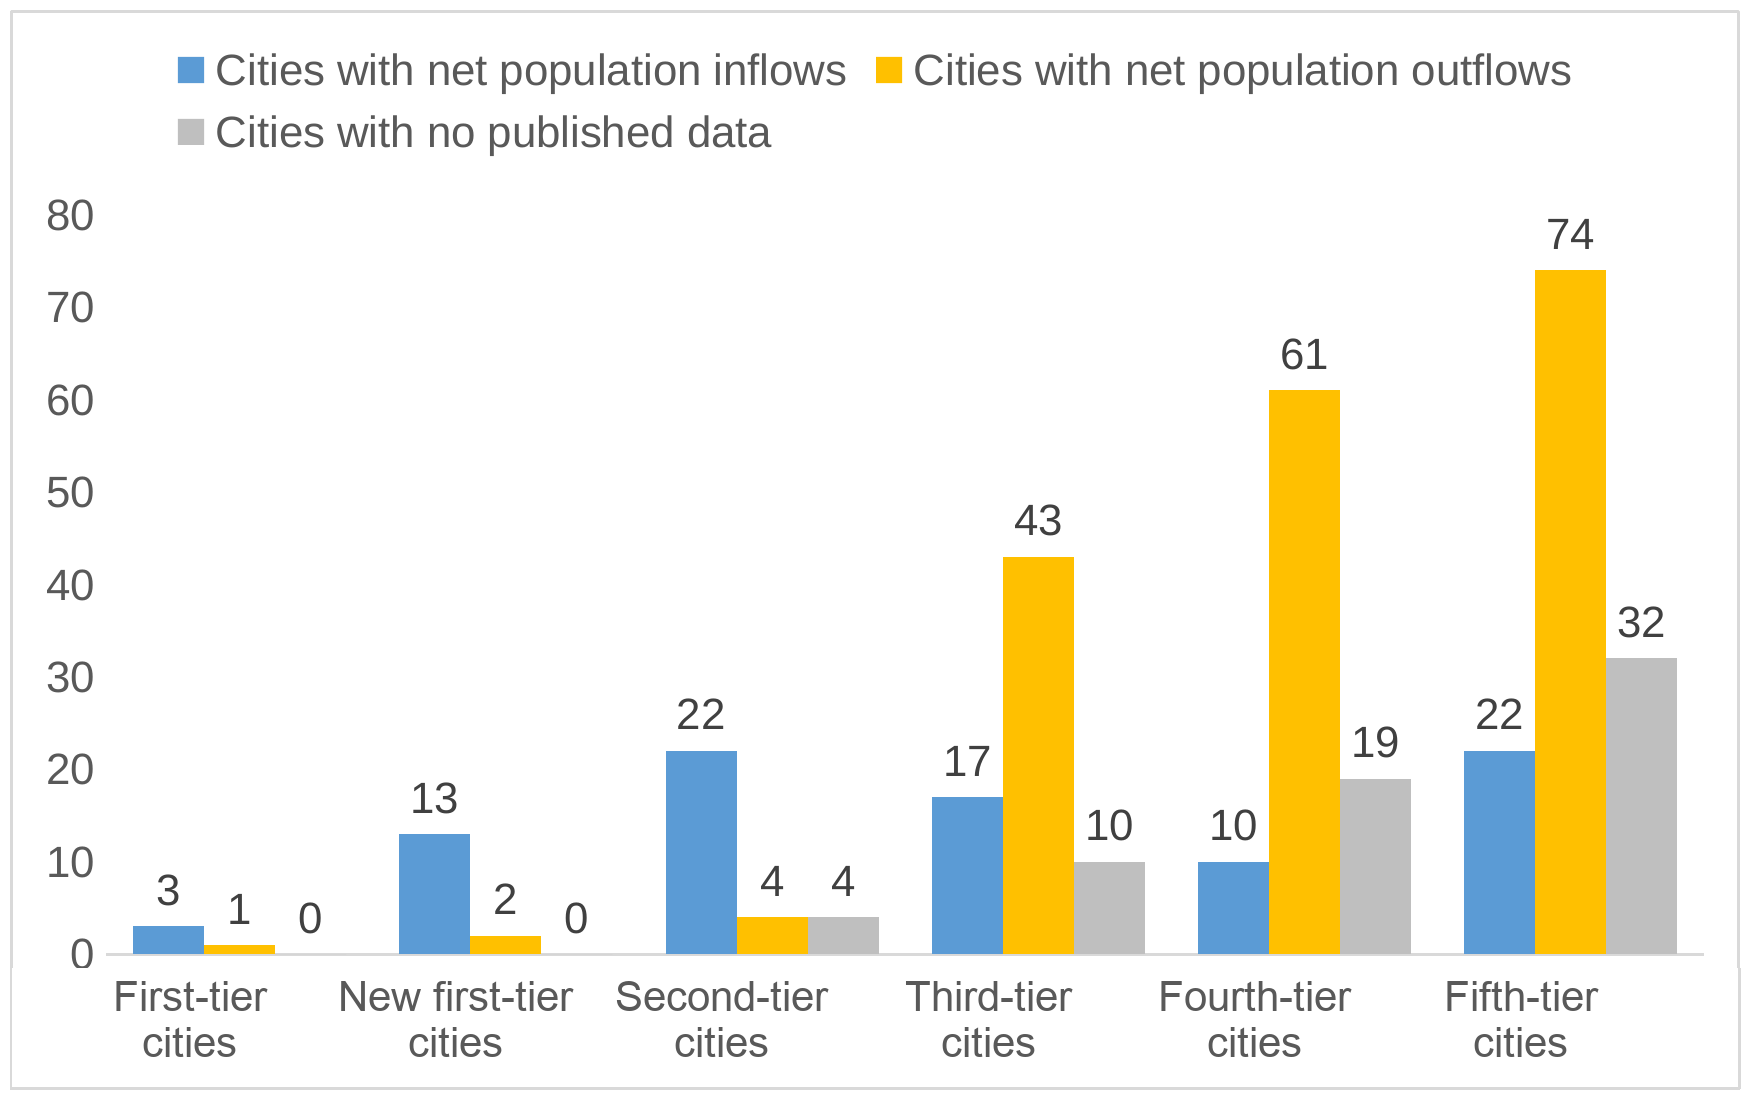
Official data show that between 2017 and 2025, only 11 of mainland China’s 31 provincial-level regions recorded net population inflows after excluding natural population growth. Zhejiang overtook Guangdong to rank first nationwide: its permanent resident population rose from 61.70 million in 2017 to 67.01 million in 2025, an increase of 7.6%, compared with 2.1% in Guangdong over the same period.
The concentration is even more striking within the more developed regions. Between 2017 and 2025, Guangzhou and Shenzhen accounted for more than half of Guangdong’s increase in permanent residents, while Hangzhou and Ningbo accounted for more than 95% of Zhejiang’s. Population growth in Suzhou, Nanjing and Chengdu also far exceeded the overall increases in their respective provinces.
Against this backdrop, we propose measures covering demographic and migration trends as well as market mechanisms.
First, China’s macroeconomic policymakers should take greater account of future population decline, lower population mobility, and changing patterns of regional migration. The National Development and Reform Commission should lead a cross-ministerial coordination mechanism to reassess investment plans for high-speed railways, expressways, airports, and other major transport infrastructure.
As noted above, China’s population is likely to become increasingly concentrated in first-tier cities, new first-tier cities, and provincial capitals. In the future, perhaps two-thirds of Chinese cities will experience net population outflows, while more than 80% may see declines in their permanent resident populations. Transport planning should therefore look further ahead. In economically developed regions where population inflows are expected to continue, expressways, high-speed railways and metro lines should still be built where necessary. In more remote areas likely to experience substantial population outflows, however, investment in railways, expressways, and airports should be strictly constrained.
Fiscal transfers now exceed RMB 10 trillion and account for an increasingly large share of China’s public expenditure. Yet they often flow in the opposite direction from population movements, which appears inconsistent with the principle of equal access to basic public services. As China places greater emphasis on “investment in people”, fiscal transfers should better reflect where people live and move, making public spending more effective.
Moreover, local governments account for as much as 86% of China’s fiscal expenditure, leaving the central government with limited room for macroeconomic management. In infrastructure investment, a greater share of responsibilities and fiscal resources should be shifted to the central level, with local governments taking on a smaller share. This would also increase the central government’s share of overall fiscal expenditure.
Second, at the operational level, the debt pressure created by continued expansion of transport capacity needs to be addressed, including through more flexible pricing for buses, urban rail, and high-speed rail. For example, high-speed rail fares could be adjusted more flexibly across seasons to better reflect fluctuations in demand. Among China’s first-tier cities, Shenzhen, Guangzhou, Beijing and Shanghai recorded relatively high metro passenger intensity in 2025 and could consider fare increases.
Meanwhile, travel subsidies for elderly people, vulnerable groups, people with disabilities or illnesses, and low-income residents could instead be provided through discounted fare schemes targeted specifically at these groups. The eligibility threshold for elderly benefits should be aligned with international practice and set at 65 and above. The broader direction of reform should be to shift public transport from a universal benefit for all passengers towards support focused on specific groups, making subsidies more targeted while reducing the fiscal burden.
Urban bus routes in significant oversupply should be reduced or suspended where appropriate. Some routes could be contracted out to private transport operators to better meet the travel needs of different passenger groups. Reducing an oversized bus fleet would not only ease fiscal pressure but also help relieve congestion on urban roads.
Third, local officials should uphold the principle that “new officials must also deal with legacy problems” and adopt a correct view of governance performance. For completed expressways, high-speed railways, and urban rail networks that have fallen short of the passenger, traffic-intensity, or revenue targets set in their original feasibility studies, the reasons should be carefully examined and accountability imposed where appropriate.
To address local governments’ long-standing reliance on infrastructure investment to drive GDP growth, a stricter performance evaluation framework is needed to curb inefficient investment. For example, current Ministry of Transport requirements for launching urban rail projects consider passenger intensity, local GDP, and fiscal revenue, but not local debt levels. A city’s debt burden should also be taken into account when determining whether it qualifies to build a metro system.
Appendix: Notes on Units of Measurement
Passenger journeys (billion journeys): The number of passenger journeys made in a year, irrespective of distance travelled. Each trip counts as one passenger journey, whether the passenger travels 2 kilometres or 2,000 kilometres. This measure indicates the total number of journeys provided by a transport service.
Passenger turnover (billion passenger-kilometres): Passenger turnover is calculated by multiplying the number of passenger journeys by the distance travelled: passenger journeys × kilometres. For example, one passenger travelling 100 kilometres generates 100 passenger-kilometres. By incorporating both passenger numbers and distance travelled, this measure reflects the total volume of transport work performed.
The distinction: Passenger journeys measure how many trips were made, while passenger turnover measures both how many trips were made and how far passengers travelled. Passenger turnover is therefore the appropriate measure when comparing how intensively different routes are used. For example, if Shanghai Metro Line 2 and the Beijing–Guangzhou high-speed railway each carry 100 million passenger journeys, but their average journey lengths are 10 kilometres and 1,000 kilometres respectively, the passenger turnover of the former is only 1% of that of the latter.
Freight volume (billion tonnes) and freight turnover (billion tonne-kilometres): The same principle applies to freight transport. Freight volume measures the weight of goods carried, while freight turnover is calculated as tonnes carried × kilometres travelled.
Traffic intensity (thousand passenger-kilometres per kilometre for passenger transport; thousand tonne-kilometres per kilometre for freight transport): This measure is calculated as turnover ÷ total route length. It distributes the total transport work performed in a year across each kilometre of the network, indicating how intensively the network is used. It is a standard measure in both road and rail transport. A higher value indicates greater asset utilisation, while a sustained decline suggests that network expansion has not generated a corresponding increase in traffic.
For urban bus and metro systems, traffic intensity is generally calculated using passenger journeys rather than passenger turnover. This is because variations in journey length within an urban network are relatively small, meaning that the distance component can be treated as broadly constant and therefore omitted.

Li Xunlei warns against excessive industrial investment amid declining demand and population

Li Xunlei is Chief Economist at Zhongtai Financial International Limited and has worked extensively at other Chinese securities companies, including Junan Securities, Guotai Junan Securities, and Haitong Securities. He is one of the most renowned chief economists among major domestic securities firms in China.
Li Xunlei: one billion people in China have never been on a plane

“One billion people in China have never been on a plane” has become a minor meme to be wheeled out whenever the conversation turns to weak consumption and an economy short of effective demand. It was first put forward in early 2019 by Li Xunlei, one of the most renowned chief economists among major domestic securities firms in China, as a warning that “…
Li Xunlei: China Is Growing Older — and Less Mobile

A new report on China’s births, ageing, and internal migration finds that even a substantial recovery in fertility would do little to slow ageing before 2050.
Li Xunlei: a data-driven analysis of China’s economy challenges conventional wisdom

Li Xunlei is Chief Economist at Zhongtai Financial International Limited. Li has worked extensively at other Chinese securities banks, including Junan Securities, Guotai Junan Securities, and Haitong Securities. He is one of the most renowned chief economists among major domestic securities firms in China.
Li Xunlei: Where to Invest in China

China has no shortage of assets, but too few are worth owning. Li Xunlei, chief economist at Zhongtai Financial International Limited, an investment bank, explains that years of investment-led expansion have increased productive capacity faster than final demand, depressing prices, profits and corporate returns. Meanwhile, China’s vast money supply leav…
Li Xunlei: Why China’s debt keeps climbing while others’ have eased

Li Xunlei, Chief Economist at Zhongtai Financial International Limited. Li has worked extensively at other Chinese securities banks, including Junan Securities, Guotai Junan Securities, and Haitong Securities. He is one of the most renowned chief economists among major domestic securities firms in China.
And Japan is in a blind alley.
Anywhere where you live, all over is transportation available inexpensive, discounted, or even free. A public good.
Important for the inner unity of s nation.