
Li Xunlei: Why China’s debt keeps climbing while others’ have eased
China’s counter-cyclical machine is losing steam, and it's time to invest in human capital rather than transportation infrastructure, says Zhongtai Chief Economist.


Li Xunlei, Chief Economist at Zhongtai Financial International Limited. Li has worked extensively at other Chinese securities banks, including Junan Securities, Guotai Junan Securities, and Haitong Securities. He is one of the most renowned chief economists among major domestic securities firms in China.
In a recent article, drawing on cross-country comparisons of China, the United States, Japan and Germany, Li shows that in the other three economies debt ratios ballooned during the pandemic and then drifted back toward pre-Covid levels. China’s, however, kept climbing, topping 300% in mid-2025.
Li attributes China’s sustained debt accumulation to two structural drivers: the renewed leveraging of state-owned enterprises (SOEs) and the steady rise in government indebtedness, particularly at the local level. These forces were reinforced by China’s counter-cyclical apparatus—government, the state-owned banking system and SOEs—which can mobilise credit rapidly, unlike Western systems where policy levers sit mainly with the government. Yet Li cautions that debt-financed growth is showing diminishing returns, with rising leverage no longer matched by strong gains in nominal GDP.
To address these challenges, Li calls for improving the efficiency of debt allocation: In the near term, redirect capital away from wasteful infrastructure in regions with net population outflows; over the medium term, push technological upgrading to lift productivity; and over the longer run, invest in human capital to counter demographic headwinds.
The article remains available on Li’s personal WeChat blog.
—Yuxuan Jia

大国债务:经济增长的代价
Great Powers in Debt: The Cost of Economic Growth
When an economy reaches a certain stage of development, economic growth is usually accompanied by rising debt. Therefore, debt growth can be seen as a cost or trade-off for economic growth. Recently, the National Institution for Finance and Development (NIFD) reported that China’s macro leverage ratio increased by 1.9 percentage points in Q2 2025, from 298.5% to 300.4%, surpassing 300% for the first time. Meanwhile, the United States’ “Big and Beautiful Act” was signed into law and is projected to add roughly $3.4 trillion to net primary deficits over the next decade. Given the legislation’s front-loaded deficit profile, the macroeconomic effects are likely to be strongest in the near term and to fade over time; most institutions anticipate the peak impulse to GDP will occur in 2028.
To investigate the drivers of China’s sustained rise in macro leverage since the pandemic, this article employs quantitative methods to estimate the debt costs associated with economic growth across four major countries: China, the United States, Japan, and Germany.
Drivers of China’s rapid debt accumulation: rising leverage in the government and state-owned enterprise sectors
In economics, the leverage ratio is a commonly used relative indicator of indebtedness: it captures the extent to which borrowing is employed to achieve economic or operational objectives. At the macro level, the leverage ratio measures the aggregate indebtedness of an economy, such as a country, and is defined as:
Macro leverage ratio = (Non-financial sector debt) / (Nominal GDP)
An economy’s macro leverage ratio rises when the growth rate of debt exceeds the growth rate of nominal GDP; that is, whenever
Debt growth rate > Nominal GDP growth rate.
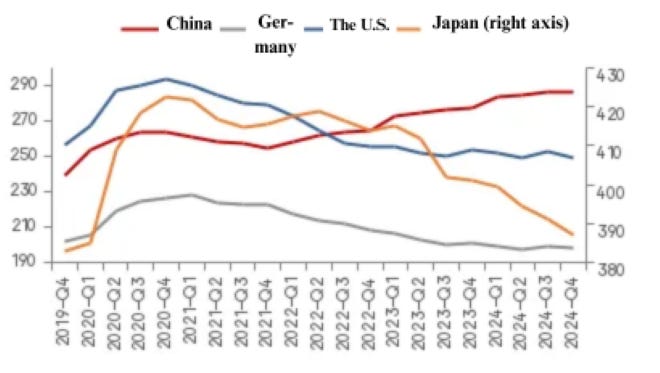
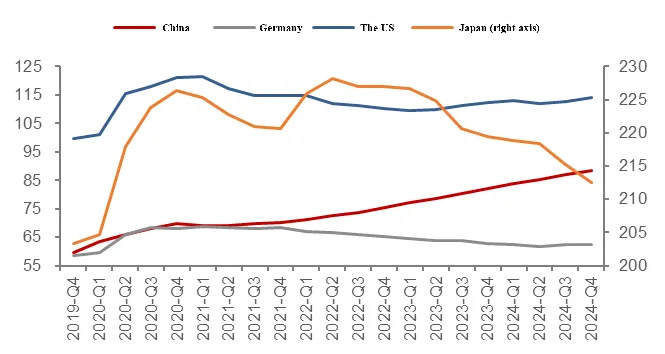
Data from the Bank of International Settlements indicate that at end-2019, macro leverage ratios in the non-financial sector in China, Germany, Japan, and the United States stood at 239.5%, 202.0%, 382.9%, and 256.3%, respectively. By end-2024 these figures had shifted to 286.5%, 198.6%, 387.0%, and 249.3%, with China registering the largest increase. In terms of dynamics, Germany, Japan, and the United States followed a “surge-and-reversal” pattern: macro leverage ratios spiked in 2020, then began to decline in Q1 or Q2 2021, and by end-2024 had roughly reverted to their end-2019 levels. In contrast, China’s macro leverage ratio has continued on a broadly upward trajectory over the period.
To facilitate comparison, the macro leverage ratios of China, Germany, Japan, and the United States are decomposed into three sectors: households, non-financial corporations, and government.
Total macro (non-financial sector) debt = Household debt + Non-financial corporate debt + Government debt
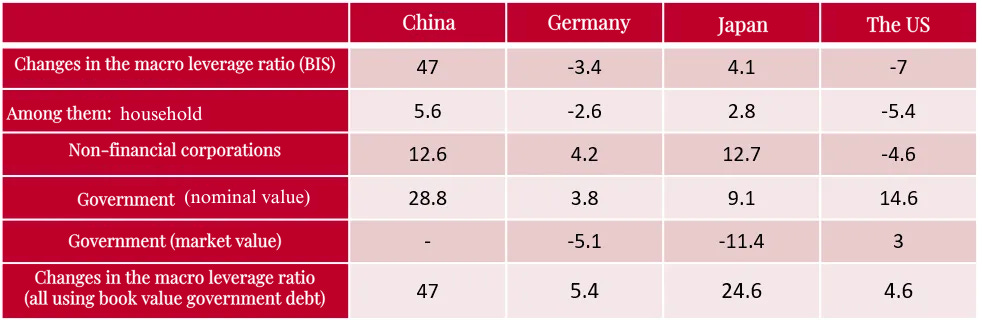
Leverage ratios in the household sectors of the four economies remained broadly stable from end-2019 to end-2024: changes were contained within roughly ±5 percentage points. China and Japan registered small increases, whereas Germany and the United States recorded modest declines. In the United States, the household leverage ratio fell by 5.4 percentage points, largely reflecting government subsidies.
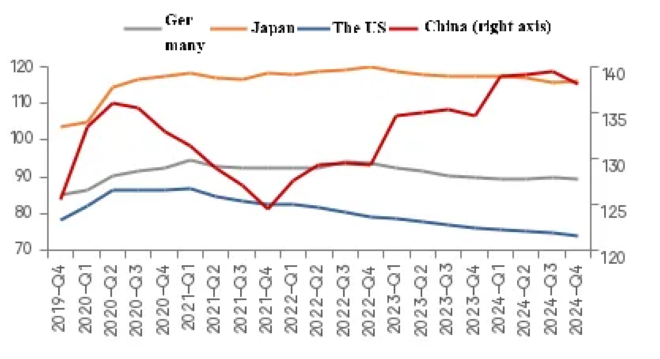
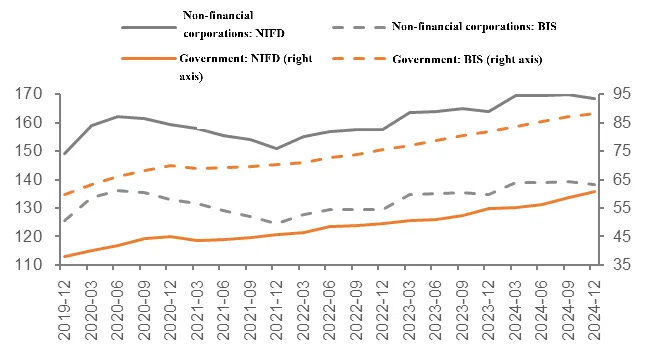
The leverage ratio of China’s non-financial corporate sector follows a “rise–fall–rise” trajectory, with a pronounced upswing since 2022, whereas Germany, Japan, and the United States display a simpler “rise–fall” pattern. China’s non-financial corporate leverage ratio rose from 125.5% at end-2019 to 136.1% Q2 2022, before declining to 124.5% by end-2021. Since 2022, non-financial corporations have resumed leveraging, with the ratio reaching a peak of 139.4% in Q3 2024. A plausible driver is the acceleration of manufacturing investment, particularly in the emerging “new trio” industries (electric vehicles, lithium-ion batteries, and photovoltaics) as well as other high-end manufacturing segments, which have contributed to the current wave of industrial rat race.
In contrast, the leverage ratios of non-financial corporate sectors in Germany, Japan, and the United States rose modestly in 2019–2020 and subsequently declined through end-2024. The principal divergence is that, unlike these economies, China experienced a renewed increase in corporate leverage after 2022.
In China, non-financial enterprises can be divided into state-owned enterprises (SOEs) and non-state-owned enterprises (non-SOEs). Against the backdrop of persistently negative growth in private fixed-asset investment, leverage among non-SOEs has not increased materially in recent years. Because neither the BIS nor the NIFD reports leverage ratios by ownership type, this analysis relies on A-share listed company data.
Data indicate that since 2019, the average asset-liability ratio of SOEs (85.6%) has exceeded that of non-SOEs (78.3%). In terms of dynamics, SOE leverage has risen appreciably since 2022, whereas non-SOE leverage first declined and then recovered, remaining broadly stable. These patterns suggest that the post-pandemic increase in corporate leverage has been driven primarily by SOEs.
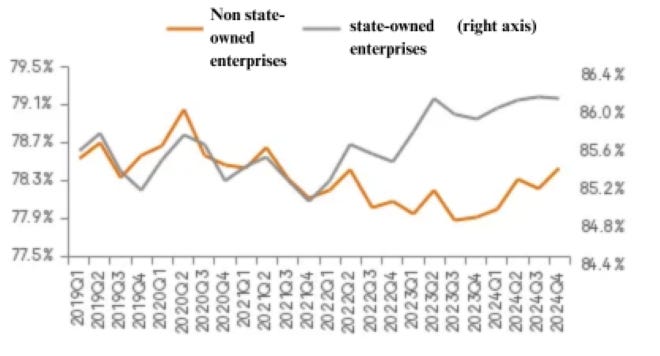
Note: SOEs comprise both centrally administered and locally administered state-owned firms; non-SOEs include all other ownership types. Sample points with missing data have been removed.
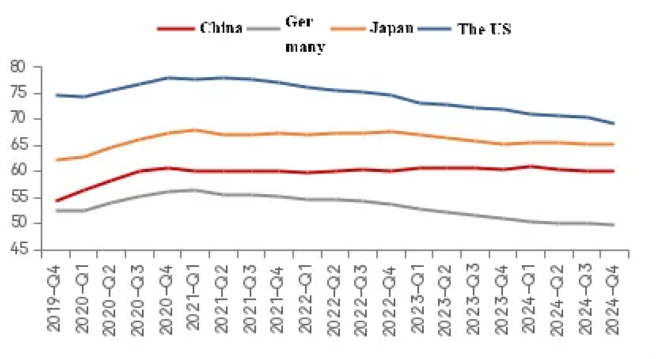
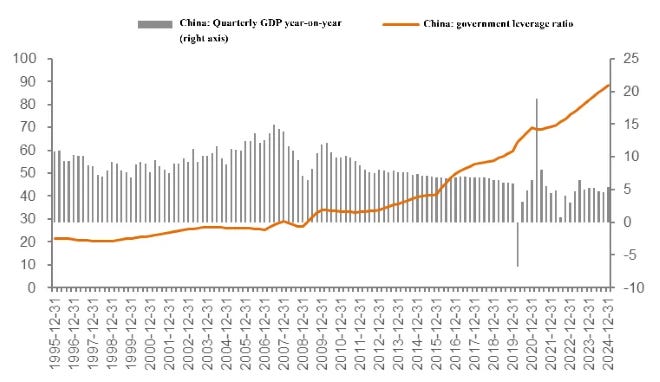
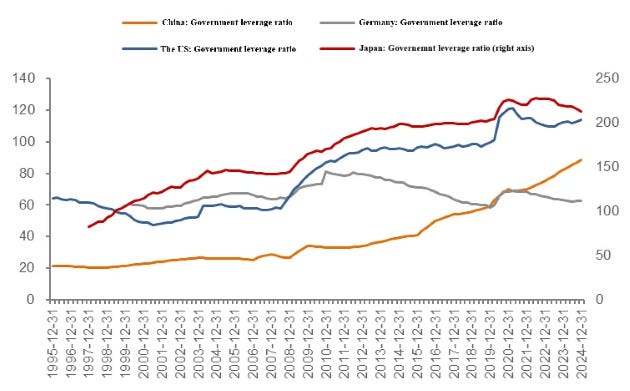
Equally noteworthy is the sustained rise in China’s government leverage ratio in recent years, in contrast to the “increase-then-decline” pattern observed in Germany, Japan, and the United States. China’s government leverage ratio climbed steadily from 59.6% at end-2019 to 88.4% at end-2024. By comparison, Germany’s government leverage rose from 58.6% at end-2019 to 68.9% at end-2021, then gradually fell to 62.4% by end-2024. Japan and the United States experienced similar trajectories: their ratios rose from 203.4% and 99.5% at end-2019 to 225.3% and 121.4% at end-2021, respectively, before declining to 212.5% and 114.1% by end-2024.
From a longer-term perspective, two features stand out in the evolution of China’s government leverage ratio. First, major increases in the past have been concentrated in periods of global turbulence, such as the 2008 U.S. subprime mortgage crisis (Although the ratio declined by 2.2 percentage points in 2008 relative to 2007, it surged by 7.3 percentage points in 2009), reflecting the adoption of strong counter-cyclical measures aimed at stabilising growth during the crisis.
When developed economies face crises, their government leverage ratios also rise sharply, yet GDP often contracts. This may be due to either weaker counter-cyclical capacity relative to China or the diminishing marginal returns of debt-driven growth. In 2008, for instance, developed economies already exhibited notably higher government leverage ratios than China but experienced markedly lower growth rates.
The relative effectiveness of China’s counter-cyclical policies lies in the coordinated response across government at both central and local levels, banks, and SOEs to deploy counter-cyclical measures to cushion downturns, whereas private firms and households tend to respond pro-cyclically. In Western economies, counter-cyclical responses are largely confined to government policy, while businesses and households typically continue to behave in a pro-cyclical manner.
During the subprime mortgage crisis, the Federal Reserve launched three rounds of quantitative easing beginning in 2008, with discernible effects only emerging around 2016. A key reason was that U.S. commercial banks, being privately owned, were reluctant to expand credit, while firms were similarly hesitant to borrow; many listed companies prioritised share repurchases over new investment. By contrast, China’s predominantly state-owned banking system was more willing to undertake counter-cyclical lending.
The second feature is that the rise in China’s government leverage ratio does not appear tightly linked to episodes of global financial crises. For example, between end-2015 and end-2017, China’s government leverage increased by roughly 13 percentage points, while the ratios in the United States and Japan were broadly stable, and Germany’s declined. Since the pandemic, China’s trajectory has again diverged from those of the other three economies. Taken together, these patterns suggest a long-run attenuation in the effectiveness of counter-cyclical policies and indicate that such measures have limited traction on deeper structural challenges. Accumulated structural problems may, in turn, complicate the implementation of counter-cyclical adjustments.
Two clarifications are needed in calculating government-sector leverage. First, regarding statistical scope: the BIS and NIFD report different figures for China’s government leverage ratio. The principal source of divergence is classification. The BIS allocates to the government sector certain debts of non-financial enterprises closely linked to the state, likely hidden local government debts, whereas the NIFD assigns these to the non-financial corporate sector. As of end-2024, the BIS estimate of non-financial corporate leverage was 30.3 percentage points lower than the NIFD’s, while the BIS’s estimate of government leverage was 27.6 percentage points higher than the NIFD’s, yielding a roughly offsetting difference.
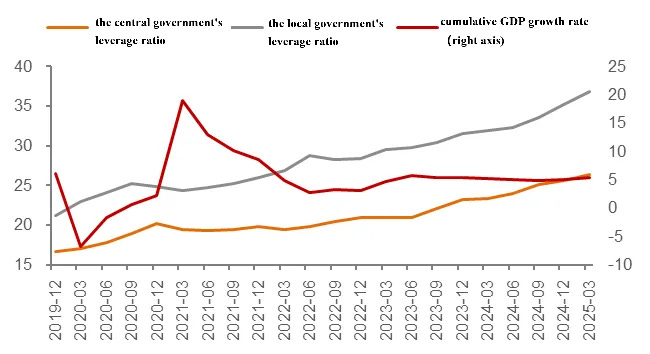
The NIFD further distinguishes between central and local government leverage ratios. Since the pandemic, both have continued to rise, from 16.7% and 21.2% at end-2019 to 26.4% and 36.8% by end-Q1 2025, respectively, implying a faster increase at the local level. This is largely attributable to the issuance of special-purpose local government bonds in recent years. Overall, government leverage has trended upward since the pandemic, while cumulative GDP growth has levelled off with a mild deceleration. This pattern indicates that expanding government leverage alone is no longer sufficient to deliver rapid GDP growth, pointing to diminishing returns from debt-financed expansion.
The second issue concerns valuation methodology. The BIS reports government-sector leverage using two approaches—nominal value and market value—and recommends using the market value whenever available, with nominal values as a complementary measure. For China, the BIS publishes only nominal-value estimates; for Germany, Japan, and the United States, it provides both nominal- and market-value series.
For comparability, this analysis adopts nominal-value accounting for government leverage across all economies. In the BIS data, China’s macro leverage ratio is constructed as the sum of household, corporate, and government leverage, all measured at nominal value, whereas for Germany, Japan, and the United States, it is the sum of household and corporate leverage plus government leverage measured at market value.
If changes in macro leverage ratios are measured uniformly as the sum of household, corporate, and government leverage calculated on a nominal-value basis, then the ratios for Germany, Japan, and the United States also show increases, though the magnitude is smaller than that observed for China.
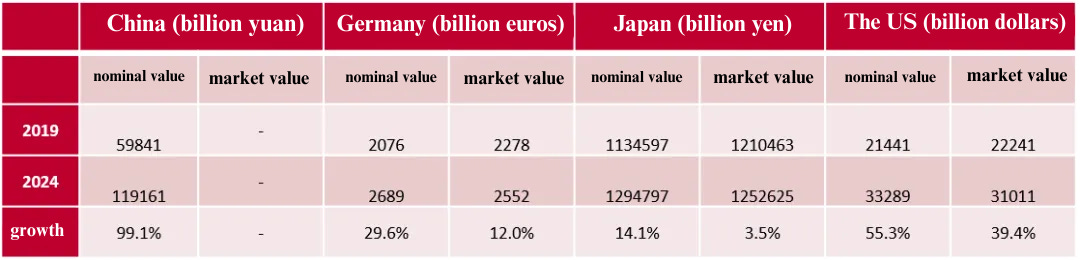
So how large is the difference between the nominal and market values of government debt, and what explains it? According to BIS data on local-currency government debt, by end-2024, China’s government debt at nominal value had nearly doubled relative to end-2019. Over the same period, nominal government debt in Germany, Japan, and the United States rose by 29.6%, 14.1%, and 55.3%, respectively, whereas the corresponding market-value increases were markedly smaller—12% for Germany, 3.5% for Japan, and 39.4% for the United States.
Given that government debt excluding loans consists predominantly of bonds, the main reason market-value debt growth lags behind nominal-value debt is the increase in bond yields. As yields rise, the market prices of outstanding bonds fall, thereby reducing the value of debt when measured at market prices. Since 2022, 10-year government bond yields in Germany, Japan, and the United States have all risen significantly.
In summary, the post-pandemic divergence in macro leverage ratios across China, Germany, Japan, and the United States can be explained by the composition of debt sources:
China’s non-financial corporate sector embarked on a renewed leveraging cycle after 2022, led primarily by SOEs.
The increase in China’s government debt (measured at nominal value) exceeded that of Germany, Japan, and the United States, while the growth payoff from government borrowing appears weaker than in earlier periods.
In Germany, Japan, and the United States, rising interest rates reduced the market value of outstanding government bonds, so market-value measures of government debt lagged behind their nominal-value counterparts.
Does rising leverage stem from insufficient economic growth? Weak price levels as a drag on nominal GDP
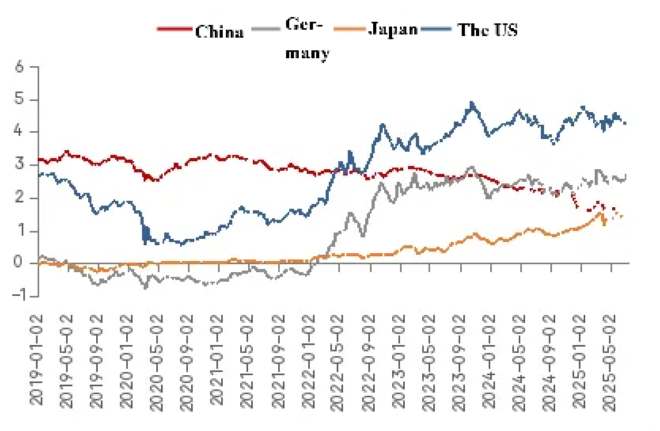
U.S. Treasury Secretary Scott Bessent said that if U.S. GDP expanded more rapidly, the government leverage ratio would fall, since nominal GDP functions as the denominator in the calculation. In recent years, although China’s real GDP growth has outpaced that of the United States, the absolute gap between the two economies has continued to widen, reflecting the comparatively slower growth of China’s nominal GDP.
Nominal GDP = Real GDP × (1 + GDP growth rate) × (1 + GDP deflator)
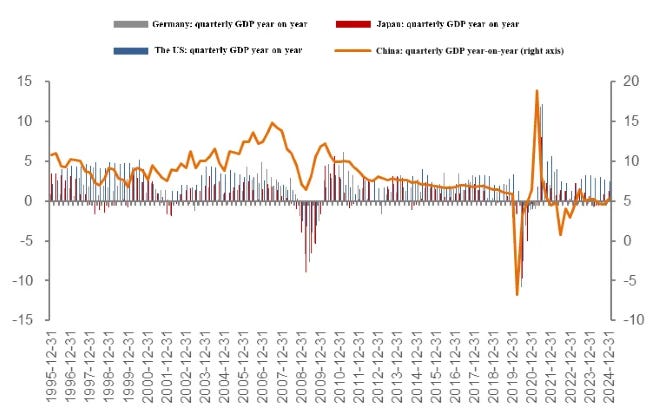
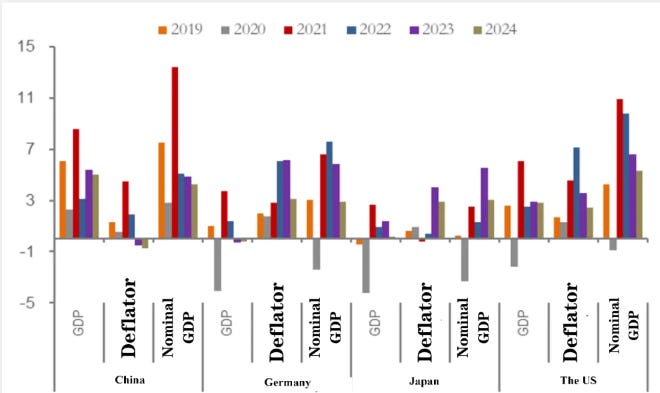
Changes in the macro leverage ratio reflect the interaction between the scale of debt (new borrowing and revaluation effects from interest-rate movements under market-value accounting) and the scale of GDP (real growth and price-level changes captured by the GDP deflator). China’s annual real GDP growth rates over 2020–2024 were 2.3%, 8.6%, 3.1%, 5.4%, and 5.0%, respectively—higher than those of Germany, Japan, and the United States in the corresponding years. However, China’s GDP deflator declined by 0.51% in 2023 and 0.71% in 2024, underperforming price dynamics in Germany, Japan, and the United States.
In nominal terms, China’s GDP growth from 2022 to 2024 consistently trailed that of the United States, lagged Germany over 2022–2023, and fell short of Japan in 2023.
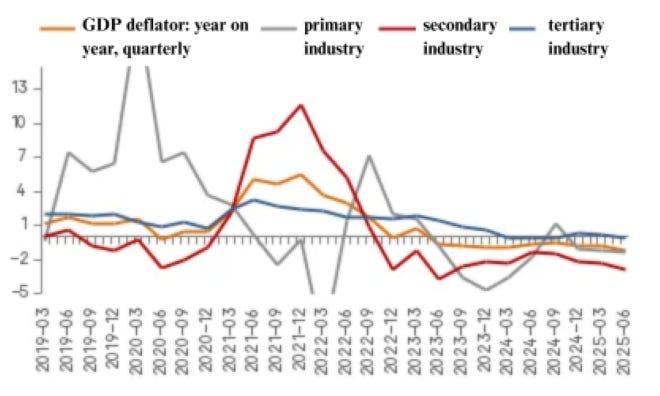
Broken down by sector, China’s GDP deflators have weakened year on year across the primary, secondary, and tertiary industries. The primary-sector deflator has posted nine consecutive year-on-year declines since 2023 Q2, while the secondary-sector deflator has fallen for eleven straight quarters since 2022 Q4. The tertiary-sector deflator also turned negative in the final three quarters of 2024 and again in 2025 Q2. Depressed price levels weigh on nominal GDP growth and hinder reductions in macro leverage ratios.
How to reduce the cost of sustaining growth
Reducing local-government leverage has long been an explicit policy objective. In recent years, the central authorities have introduced a range of measures to address hidden local government debts. Comparative analysis nonetheless suggests room to improve the efficiency with which policy resources are deployed—by optimising capital allocation in the short term, fostering technological upgrading in the medium term, and supporting population growth over the longer horizon.
From an international vantage point, China faces the challenge of “liabilities before prosperity.” Macro leverage ratios are generally positively correlated with GDP per capita: globally, each additional $10,000 of per capita income is associated with roughly an 18-percentage-point increase in the macro leverage ratio. China’s position lies notably above this trend line.
Japan’s macro leverage ratio is also high relative to its GDP per capita level. BIS data show that when Japan’s leverage ratio was first recorded (end-1997), GDP per capita was $35,600, and the macro leverage ratio stood at 296.3%. However, Japan’s relative debt burden in 1971 was lower than China’s at end-2024 (GDP per capita at $13,300 and macro leverage ratio at 286.5%).
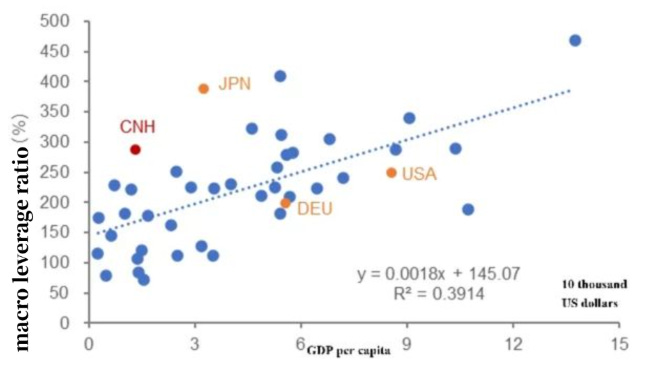
Note: GDP per capita is based on 2024 data (current U.S. dollars), and the macro leverage ratio is as of the end of 2024.
Under the production function, GDP growth = contribution of labour growth + contribution of capital growth + contribution of total factor productivity (TFP) growth.
Accordingly, improving the efficiency with which debt resources are used—so that debt growth more effectively augments capital, labour, or TFP contribution—can help moderate the macro leverage ratio. The discussion that follows considers avenues to raise the efficiency of debt use from the perspectives of labour, capital, and TFP.
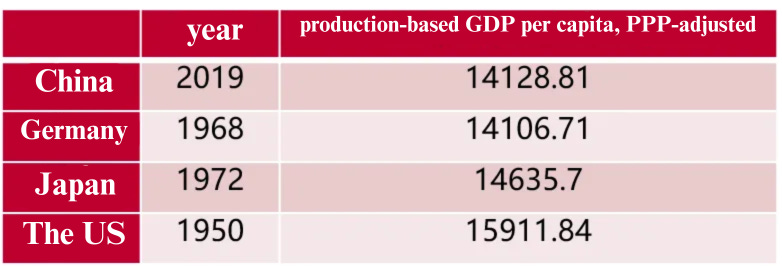
Using the Penn World Table 10.01 (updated through 2019) and China’s GDP measured by the production approach, per capita GDP was computed as PPP-adjusted production-based GDP divided by total population for each year. This procedure identifies the years in which Germany, Japan, and the United States were at comparable development levels to China. Because U.S. PPP-adjusted production-based per capita GDP in 1950 (the earliest observation) already exceeded China’s 2019 level, subsequent comparisons focus on China, Germany, and Japan. To align development stages, Germany’s and Japan’s series are shifted by 51 and 47 years, respectively. So, for example, China 2019 corresponds to Germany 1968 and Japan 1971.
With exports under pressure and the macro leverage ratio already among the highest globally, China’s ability to sustain growth will ultimately depend on improvements in labour productivity. A simplified decomposition is:
Labour productivity growth = Labour quality + TFP + Contribution of capital intensity
In recent years, China’s labour productivity growth has relied chiefly on capital input, such as capital intensity (capital–labour ratio). The contribution of TFP has been broadly stable, as reform dividends diminish, while gains in labour quality have slowed, as evidenced by the difficulties college graduates face in securing employment.
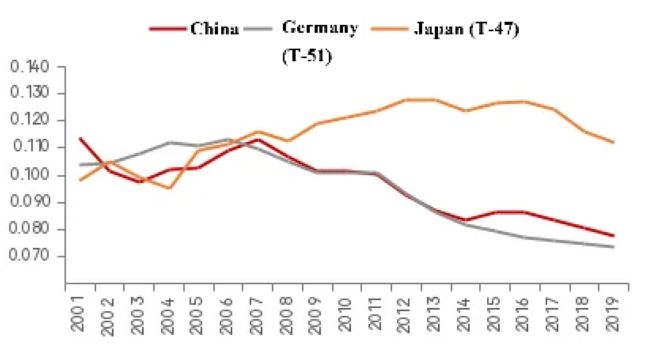
The 2025 Government Work Report proposed that “more funds and resources will be invested in people,” indicating scope for improvement regarding human capital. Here, human capital refers not to the size of the labour force but to the education and skill profile of each worker. Although China’s population is far larger than Germany’s or Japan’s and labour quality has improved markedly in recent years, its human capital index, constructed from years of schooling and returns to education, remains below that of Germany and Japan at comparable stages of development. With China’s total and working-age populations now beginning to decline, upgrading labour quality has become even more critical.
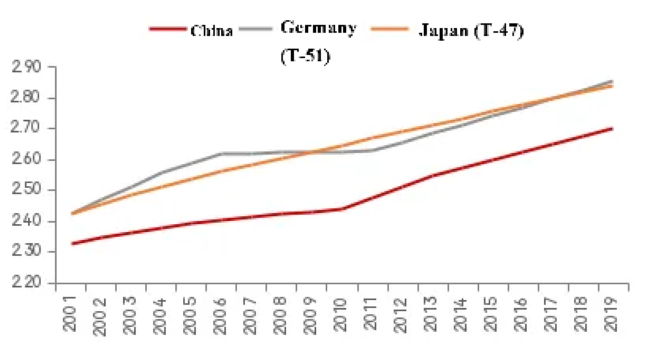
Note: The reference year for China is T, Germany is T-51, and Japan is T-47. The Human Capital Index is compiled based on years of education and returns to education.
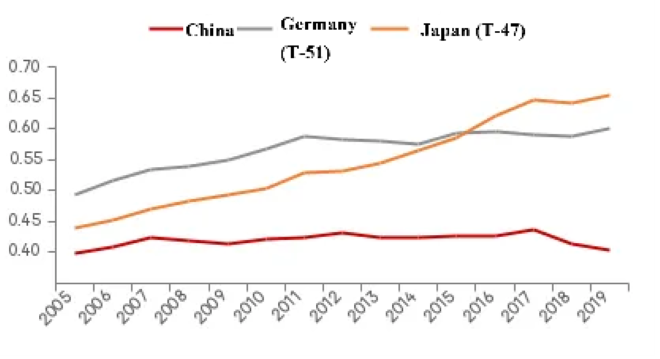
Moreover, China has vast potential for scientific development and technological advancement. By the TFP index, China’s level in 2019 was 0.4, well below Germany (0.6) and Japan (0.65) at comparable stages of development, and far short of the United States (1). This gap underscores the critical importance of channelling resources toward the integrated development of “education development, scientific and technological innovation and talent cultivation.”
In the 1970s, Japan experienced its first real estate bust. In response, the government embarked on expansive, inefficient infrastructure investments, dubbed an “infrastructure mania.” A prominent example was Prime Minister Kakuei Tanaka’s Building a New Japan: A Plan for Remodelling the Japanese Archipelago, which posited that only large-scale transport networks could narrow urban–rural disparities by both relieving metropolitan congestion and revitalising the country. The result was significant excess investment, which the U.S. writer Alex Kerr (author of Dogs and Demons) mocked as “It is easiest to paint demons.”
Japan’s elevated macro leverage can thus be traced, in part, to previous central-government overinvestment. Nevertheless, Japan exhibits a relatively compressed distribution of household income, and corporate-sector leverage remains below China’s. Therefore, the structural challenges China faces today still require more effort to address.
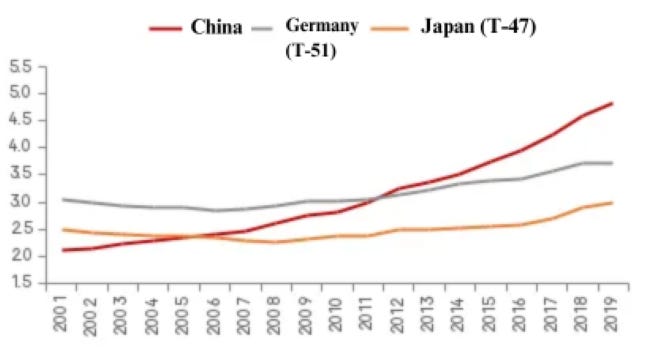
China also faces challenges associated with a high capital stock and diminishing returns on investment. By end-2019, China’s capital stock (in constant 2017 prices) was 4.84 times GDP, substantially higher than Germany’s (3.72) and Japan’s (2.98) at comparable stages of development. Consistent with diminishing marginal returns to capital, China’s actual internal rate of return (IRR) has fallen from a peak above 20% to 7.7% in 2019, similar to Germany’s (7.3%) at a comparable stage but below Japan’s (11.2%), which maintained a smaller capital stock.
Consequently, reliance on capital expenditure, such as physical investment, to propel growth has become less efficient and risks further elevating macro leverage. Policy priorities should therefore include: (i) optimising resource allocation in the near term to curb redundant and excessive investment; (ii) advancing industrial development through technological progress over the medium term; and (iii) implementing a comprehensive population strategy over the long run.
Since the early 2000s, the contribution of capital formation to China’s GDP growth rose markedly, peaking around 2012 before trending downward. In terms of the growth contribution of capital investment, China significantly exceeds the United States. Yet the share of ICT-related investment (information, communications, and software) in total capital investment is only about 10% in China, compared with more than 50% in the United States, indicating a relatively low intensity of digital and technological investment in China.
From January to July of this year, China’s fixed-asset investment grew by just 1.6% year on year, held back primarily by the contraction in real-estate development investment. This pattern signals a shrinking set of viable investment options, making it increasingly difficult to stabilise growth through sheer expansion of investment—underscored by the unusual year-on-year decline in bank lending in July.
Since 2020, China’s top policymakers have emphasised the “new development paradigm” and “high-quality growth.” The former focuses on smoothing internal and external circulations, while the latter prioritises improving the input–output ratio (i.e., raising investment efficiency). Recent policy discourse has also stressed curbing the industrial rat race. To strengthen circulation, the only viable path is to expand consumption. With the advent of the AI era, China’s labour productivity can be expected to rise further; however, this will still require carefully balancing short-term growth stabilisation against longer-term development strategies.
Huang Yiping on China’s role in the Global South

Huang Yiping, Boya Distinguished Professor, Dean of the National School of Development (NSD), Dean of the Institute of South-South Cooperation and Development (ISSCAD) at Peking University, recently argued that China’s success model cannot be directly replicated by Global South countries and encouraged Global South students to adopt China’s pragmatism r…
Zhao Long on China’s vision for a fairer multipolar order

This is our fifth article translated from the special series in this year’s 16th issue of 世界知识 World Affairs, a Chinese-language magazine published by World Affairs Press under China’s Ministry of Foreign Affairs. The series features contributions from some of China’s “foremost scholars,” according to the magazine, on the theme
Hu Bo: de-hegemonisation of the international maritime order and the risk of regression

This is our fourth article translated from the special series in this year’s 16th issue of 世界知识 World Affairs, a Chinese-language magazine published by World Affairs Press under China’s Ministry of Foreign Affairs. The series features contributions from some of China’s “foremost scholars,” according to the magazine, on the theme
A Legal Assessment of the United States’ “Freedom of Navigation” from Beijing

I’ve long fumed that much of what passes for “research” from certain Chinese institutions is, in reality, little more than glorified op-eds dressed up as scholarship. The dead giveaway? Footnotes—or rather, the lack thereof. And when they do exist, they’re often so perfunctory and unprofessional that you wonder if the authors assume nobody will actually…
Diao Daming: Beijing should be more active to steer China-U.S. engagement

This is our third article translated from the special series in this year’s 16th issue of 世界知识 World Affairs, a Chinese-language magazine published by World Affairs Press under China’s Ministry of Foreign Affairs. The series features contributions from some of China’s “foremost scholars,” according to the magazine, on the theme
 | A guest post by
|
His ‘analyses’ are no better than the average American economist’s. Why feature unoriginal filler like this?