
Yu Yongding: There Is No “Consumption-Driven” Growth Model, and China’s Infrastructure Investment Is Far From Saturated
Senior economist warns that China's consumption is being misread, growth is being misdiagnosed, and fiscal caution is holding back the economy.


For a growing number of economists, both outside China and increasingly within it, the central question facing the world’s second-largest economy is its exceptionally weak domestic demand. Beijing, at least rhetorically, has moved in the same direction. Over the past two years, “expanding domestic demand” has become a recurring phrase in top-level policy language, even as the state has continued to lean heavily on large-scale investment.
Against that increasingly settled consensus, Yu Yongding has stood out as a notable dissenter. One of China’s most influential economists, and a former member of the monetary policy committee of the People’s Bank of China, the central bank, Yu has argued with unusual clarity and consistency that the prevailing diagnosis is wrong. In his view, there is no such thing as a “consumption-driven” growth model. China’s growth, he insists, should still rest on investment, and the country still has ample room to invest.
Yu contends that much of the current debate muddles together short-term macroeconomic stabilisation with long-term growth theory. In the long run, growth is driven by capital accumulation, labour, and technological progress, not by consumption as such. Consumption can support growth in the short run when effective demand is weak, but it cannot, by itself, raise productive capacity or an economy’s long-term growth potential.
If the goal is to raise consumption on a lasting basis, he argues, the key is not to treat consumption itself as the source of growth, but to raise households’ permanent income. And under current conditions, he sees faster infrastructure investment, financed by a more expansionary but still sustainable fiscal policy, as the most practical way to do that.
Crucially, he rejects the now common view that China’s infrastructure build-out is close to exhaustion. On the contrary, he argues that investment space remains substantial, from transport and energy to underground utility networks and other basic public works. He also argues that the returns on such investment should not be judged narrowly by short-term commercial profitability alone, but by a broader assessment of long-term economic and social benefits, even while acknowledging the need to guard against waste, duplication, and poorly designed projects.
Yu Yongding is a former director-general of the Institute of World Economics and Politics (IWEP) at the Chinese Academy of Social Sciences (CASS). He currently serves as a research fellow at IWEP and a member of the Chinese Economists 50 Forum, a non-governmental think tank comprised of first-class Chinese economists. He also holds the title of Academician (学部委员), reserved for CASS’s highest-ranking scholars.
He delivered the following lecture on 29 October 2025, though the transcript was not made public until 2 March 2026. The Chinese transcript is available on Tencent Finance’s official WeChat blog. The transcript has been slightly edited for clarity. The video recording of the lecture has been uploaded to Tencent Video.
—Yuxuan Jia
余永定:不存在 “消费驱动”的增长方式,中国基础设施投资远未饱和
Yu Yongding: There Is No “Consumption-Driven” Growth Model, and China’s Infrastructure Investment Is Far From Saturated
Key takeaways
Without a concrete analysis of the specific causes, it is highly unreliable to infer, based on per capita income levels alone, whether China’s economy has already entered a stage of low growth.
Overcapacity is resolved primarily through market mechanisms. Through competition, price declines, losses, bankruptcies, and mergers and acquisitions, overcapacity will eventually be eliminated. Industrial policy and environmental policy can, to some extent, accelerate this process and reduce the costs of adjustment.
There is no “consumption-driven” growth model. Consumption can be said to “pull” economic growth only in the limited sense that, when effective demand is deficient, it helps offset the shortfall in demand.
Compared with China, service prices in other countries are much higher, which is why their consumption ratios are substantially higher than China’s. Once these factors are excluded, China’s consumption ratio is indeed somewhat lower, but the gap may in fact not be very large.
Household income, income expectations, and wealth, or in other words, permanent income, are the key determinants of consumption behaviour. Only a stable rise in permanent income can deliver sustained growth in consumption. How, then, can permanent income be increased? Under current conditions, the most feasible path is to raise the growth rate of infrastructure investment.
China’s fiscal position is fully sustainable. At present, inflation in China remains low, and the government should therefore adopt a more expansionary fiscal stance, raise the deficit ratio, and issue additional government bonds, especially long-term government bonds, to finance infrastructure investment and achieve an economic growth rate of around 5 per cent.
Yu Yongding is a member of the Chinese Economists 50 Forum, an Academician of the Chinese Academy of Social Sciences (CASS), and a Research Fellow at the Institute of World Economics and Politics at CASS.
Yu Yongding’s principal fields of research include macroeconomics, international finance, and the world economy. He served as a member of the Monetary Policy Committee of the People’s Bank of China and as a member of the expert committees for the 11th (2006-2010) through the 15th Five-Year Plans (2026-2030).
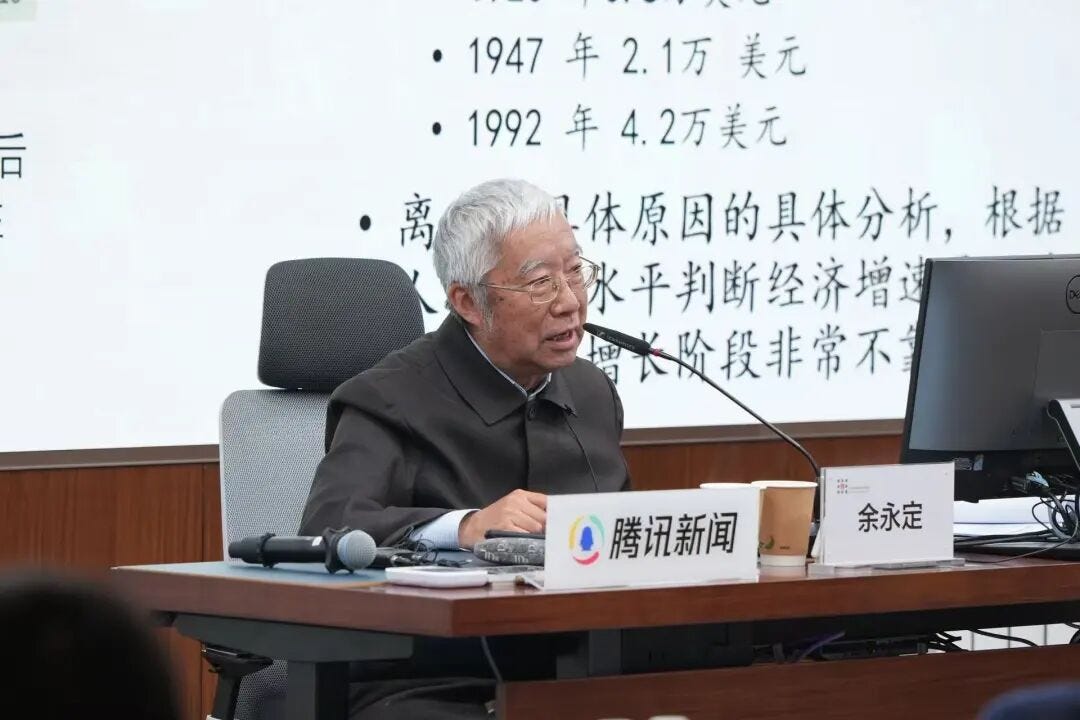
On 29 October 2025, at the 431st session of the Chang’an Forum organised by the Chinese Economists 50 Forum, Yu Yongding was invited to deliver a lecture titled “Several Conceptual Issues in Current Macroeconomics and Macroeconomic Policy.”
Yu Yongding argues that current academic debates on China’s macroeconomic policy are marked by a number of conceptual and logical errors. Long-term factors and slow variables should not be used to explain short-term phenomena. For example, demographic change, as a slow variable, cannot account for short-term fluctuations in economic growth. Nor should issues that differ in domain, time horizon, and underlying nature be conflated.
On the transformation of the growth model, Yu argues that, in practice, there is no meaningful sense in which growth can be described as “consumption-driven.” Economic growth is investment-driven and rests on savings. In the short run, however, when effective demand is insufficient, an increase in consumption demand can help support growth. As for boosting consumption, he maintains that only a sustained rise in permanent income can deliver lasting growth in consumption.
With respect to fiscal policy, Yu argues that the central issue in public finance is sustainability rather than a balanced fiscal position. Given that infrastructure investment in China remains far from saturated and inflation is very low, the government can adopt a more expansionary fiscal stance, raise the deficit ratio, and issue additional government bonds to finance infrastructure investment, thereby sustaining economic growth at around 5 per cent.
The following is a transcript of Yu’s lecture.
当前宏观经济与政策的几个认识问题
Several Conceptual Issues in Current Macroeconomics and Macroeconomic Policy
I am very pleased to share some of my thoughts. My views do not necessarily reflect the mainstream in the academic community, and some may well be incorrect. My aim is simply to engage in a frank exchange, and I welcome criticism. In my view, economists should first follow Chen Yun’s principle of “not blindly following superiors, not blindly following books, but only following facts”; that is, they should seek truth from facts.
In addition, scientific thinking is essential. My study and research in economics began with Das Kapital, moved from Marxist political economy to Western economic theory, and eventually returned to the concrete economic problems of China. One strong impression I have formed is that insufficient importance has been attached to the teaching of formal logic, especially at the university level. As a result, when economic principles are applied to the discussion of economic issues, logical errors often lead to mistaken conclusions.
Today, I would like to discuss some of the conceptual and logical errors that have arisen in debates over China’s macroeconomic policy.
01 Long-term factors and slow variables should not be used to explain short-term phenomena
Long-term factors, that is, stable and often non-quantifiable conditions, and slow variables, which are measurable but change only very gradually relative to the outcome variable, cannot account for changes in short-term phenomena measured on an annual or quarterly basis. Long-term factors and slow variables influence GDP growth through cumulative and incremental processes. Their effect on the growth rate of GDP in any particular year or quarter is typically small and difficult to identify with precision.
For example, population ageing is a slow variable. A particular indicator of population ageing cannot, by itself, explain why economic growth in a given quarter falls short of expectations. China’s GDP growth rate was 9.6 per cent in 2011, but had declined to 7 per cent by 2015. Yet in 2015, both the size of the working-age population and its rate of growth were higher than in 2011. China has indeed entered an ageing society, but the principal problem at present is unemployment rather than labour scarcity.
Moreover, there are many long-term factors and slow variables that are conducive to growth, including urbanisation, industrial upgrading, technological revolutions such as big data and artificial intelligence, and the accumulation of human capital. It is difficult to determine ex ante what the net effect of these different long-term factors and slow variables will be once their respective influences interact and partially offset one another.
Some argue that China’s growth slowdown, or at least its decline to the current range, was inevitable. I am very fond of Benjamin Franklin’s famous remark: “In this world, nothing is certain except death and taxes.” There are far fewer inevitable outcomes than is often assumed. Human agency matters. To a considerable extent, outcomes are shaped by human action. If one begins with the prior assumption that a particular long-term factor has made a decline in growth unavoidable, one may then act on the basis of that presumption, thereby helping to generate a self-fulfilling expectation.
A line of argument often employed by Chinese economists is to divide economic development into stages on the basis of a particular indicator, such as per capita income, and then to draw cross-country comparisons to demonstrate, or predict, that a given phenomenon observed in China is inevitable, or that China is bound to experience it sooner or later. This mode of reasoning is highly prone to the fallacy of hasty generalisation.
China’s per capita GDP currently stands at roughly US$13,400. As a general proposition, when a country’s per capita GDP exceeds US$10,000, certain phenomena may tend to emerge. Such comparisons offer a certain point of reference for China. But without a concrete analysis of the specific causal mechanisms at work, it is highly unreliable to infer from per capita income levels alone whether China’s economic growth has already entered a phase of low growth.
Since the beginning of the twentieth century, the United States has experienced three golden eras of economic growth: the 1920s, when annual GDP growth averaged 4.7 per cent; the period from 1945 to 1973, when annual GDP growth averaged 4.1 per cent; and the period from 1992 to 2000, when annual GDP growth exceeded 4 per cent and reached 4.8 per cent in 1998. Measured in 2023 U.S. dollars at purchasing power parity, U.S. per capita income in the initial years of these periods was US$8,000 in 1920, US$21,000 in 1947, and US$42,000 in 1992. All three were periods of rapid economic growth, yet the levels of per capita income differed enormously. This suggests that one cannot infer, merely from whether per capita income has crossed a particular threshold, that China’s growth rate must necessarily have entered a low-growth phase.
One further point deserves emphasis: in reasoning, one must not arbitrarily skip intermediate steps. A causal chain takes the form of “a-b-c-d”, with each link connected to the next; one cannot jump directly from “a” to “d”. Between the explanatory variable and the outcome variable lies a very long causal chain. For example, to begin with the proposition that “China is ageing”, bypass multiple intervening links in the causal chain, and then use that proposition to explain why China’s economic growth rate was 6 per cent in 2019 is to commit the formal logical fallacy of non sequitur.
02 Issues that differ in domain, time horizon, and underlying nature should not be conflated
Economics not only spans multiple fields, but also addresses questions defined over different time horizons. Macroeconomics, for example, is concerned with short-term issues, over horizons of a year, a quarter, or even less, whereas the study of economic growth focuses on long-term issues, typically over five, ten, or twenty years. The concepts employed in growth theory and in macroeconomics are formulated under different assumptions and therefore carry substantially different meanings; they should not be conflated. Indeed, the meaning of “economic growth” differs markedly between the short run and the long run, and between growth theory and macroeconomics.
Economic phenomena can be classified into distinct categories. A growth slowdown, deflation, overcapacity, asset bubbles, income inequality, market distortions, industrial development, urbanisation, and demographic change all constitute separate fields of inquiry. Corresponding to these are different policy domains, including macroeconomic policy, institutional reform, structural adjustment, competition policy, industrial policy, urban planning, and population policy. Policies designed for different domains should not be treated as interchangeable.
Macroeconomic stabilisation, for instance, is a short-term matter, and the relevant policies may need to be adjusted quarterly or annually. Urbanisation, by contrast, is a long-term issue, with a policy horizon of five, ten, or twenty years. Urbanisation policy may help alleviate annual deflationary pressures, but only to a limited extent. Likewise, a reduction in income inequality may have a positive effect on economic growth, but it cannot resolve deflation within the current year.
In analysing economic phenomena, close attention must therefore be paid to the domain to which a problem belongs, its time horizon, and its underlying nature. One must also determine which branch of economic theory is appropriate for analysing the issue in question. Each branch of theory should perform its proper function and operate in coordination with the others; they should not be indiscriminately lumped together.
03 “Overapacity” is not a macroeconomic problem
There is no denying that China faces a problem of overcapacity. However, overcapacity is a sectoral and product-specific issue, that is, a structural problem rather than a macroeconomic one.
In 2012, serious overcapacity existed in traditional heavy industries such as steel, cement, flat glass, electrolytic aluminium, and shipbuilding. At the same time, however, many sectors were characterised by excess demand, including semiconductor chips, precision machine tools and industrial robots, infant formula, high-end consumer goods, advanced materials in the photovoltaic supply chain, wastewater treatment and air-purification equipment, cloud computing and big-data services, and key smartphone components. Even within industries suffering from overcapacity, many subsectors and products remained in short supply, such as high-end automotive sheet steel, especially high-strength steel and galvanised sheet, silicon steel, especially high-grade non-oriented electrical steel and grain-oriented electrical steel, high-end bearing steel such as GCr15, gear steel for high-speed rail, high-end stainless steel, special alloy steels such as high-temperature and corrosion-resistant alloys, and ultra-thick or ultra-wide steel plate.
Overcapacity is resolved primarily through market mechanisms. Through competition, price declines, losses, bankruptcies, and mergers and acquisitions, overcapacity will gradually be eliminated. Industrial policy and environmental policy can, to some extent, accelerate this process and reduce the costs of adjustment.
For a long time, a prevailing view of China’s macroeconomic conditions has been that “overcapacity”, understood as aggregate supply exceeding aggregate demand, is the principal macroeconomic problem, and that the objective of macroeconomic policy should therefore be to eliminate such “overcapacity”. In theoretical terms, however, macroeconomic policy has four standard objectives: full employment, economic growth, price stability, and external balance. In general, the primary objective of macroeconomic policy in market economies such as Australia and New Zealand is to contain inflation. Advanced economies typically adopt an inflation target of 2 per cent, while developing economies generally target a higher rate. In the United States, the two principal objectives of macroeconomic policy are price stability and employment. No country other than China treats “overcapacity” as an objective of macroeconomic policy.
Since John Maynard Keynes, overcapacity has not been understood as a macroeconomic problem. The overcapacity narrative omits a crucial time dimension: aggregate supply is determined by past investment and is therefore given in the current period. Policymakers can influence aggregate demand in the short run, but they cannot directly alter aggregate supply within the same period. At the macroeconomic level, therefore, only two forms of disequilibrium are possible: either aggregate demand exceeds aggregate supply, producing inflation and economic overheating, or aggregate demand falls short of aggregate supply, producing deflation and economic slack.
The choice between expansionary and contractionary macroeconomic policy depends primarily on two indicators, namely economic growth (or employment) and inflation, rather than on whether “overcapacity” is said to exist. The macroeconomic policy toolkit contains no instruments for resolving overcapacity at the industry level. The price mechanism in the market remains the principal means of addressing it. The disciplining function of market competition, in which more efficient firms survive and less efficient ones exit, should therefore be allowed to operate fully. Local governments should avoid subsidising industries with overcapacity in ways that keep alive firms that ought to be merged, acquired, or closed.
A person cannot walk in two directions at the same time. But it is entirely possible to use macroeconomic policy to stimulate effective demand while also relying on the market price mechanism, competition policy, industrial policy, environmental policy, and tax policy to address overcapacity. These two approaches are not contradictory. They can proceed in parallel and complement one another.
04 There is no “consumption-driven” growth model
Paul Krugman, Larry Summers, and others have argued that China’s “investment-driven” growth model has reached its limits and that China should shift from an investment-driven to a consumption-driven model. Economic growth, however, is driven by capital accumulation, effective labour input, and technological progress. The rapid accumulation of capital has been the single most important reason China became the world’s largest manufacturing power and acquired strong international competitiveness.
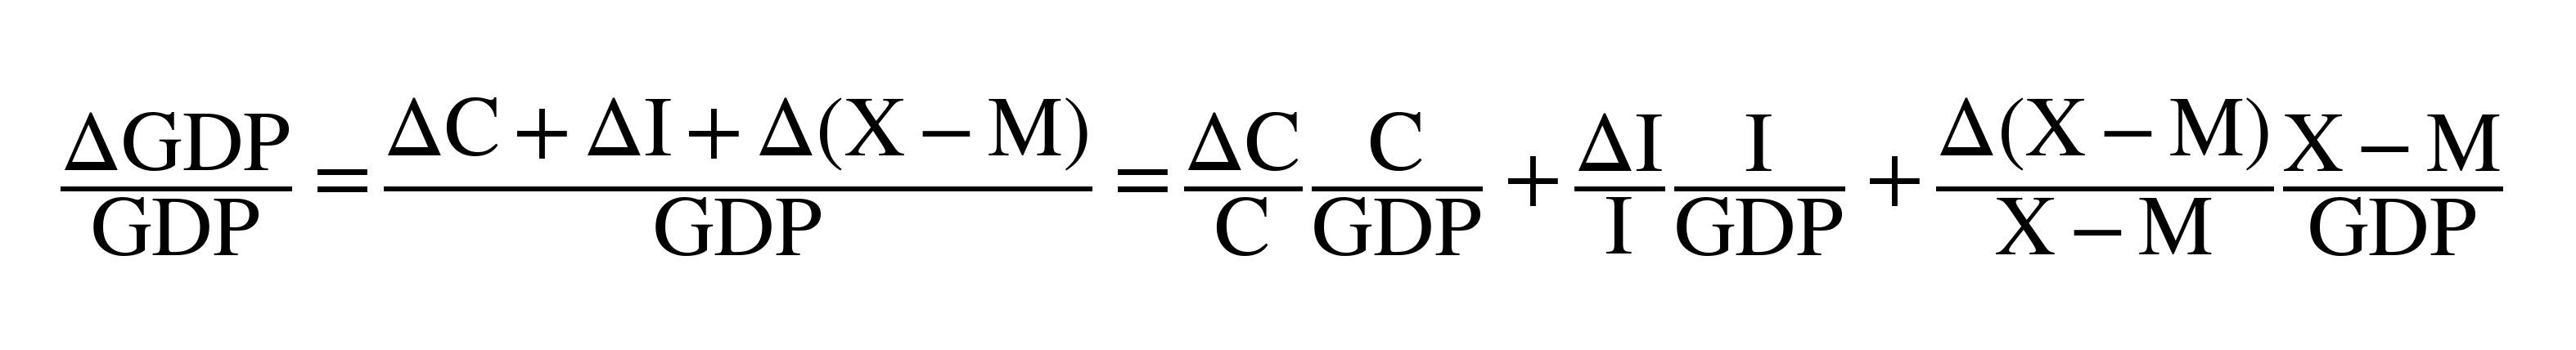
In reality, there is no “consumption-driven” growth model. In the Harrod-Domar model, the rate of growth of output = savings ratio / capital-output ratio, under the assumption that the saving rate equals the investment rate. It is important to note that growth theory abstracts from demand constraints. Its implicit assumption is that supply generates its own demand, broadly in the spirit of Say’s Law.
In growth theory, output, or GDP, is understood as a supply-side concept. The growth rate, therefore, refers at once to both the actual growth rate and the potential growth rate. In macroeconomics, by contrast, when effective demand is insufficient, actual output falls below productive capacity, and actual growth falls short of potential growth. The purpose of macroeconomic policy is to raise effective demand and close the gap created by deficient demand. For analytical convenience, macroeconomics assumes that supply is unconstrained in the short run, while actual output, or GDP, is determined by effective demand. Hence, “growth” in growth theory and “growth” in macroeconomics are not the same concept: in the long run, growth is not constrained by demand, whereas in the short run, it is not constrained by supply.
The formula for the dynamic model of the production function is as follows:
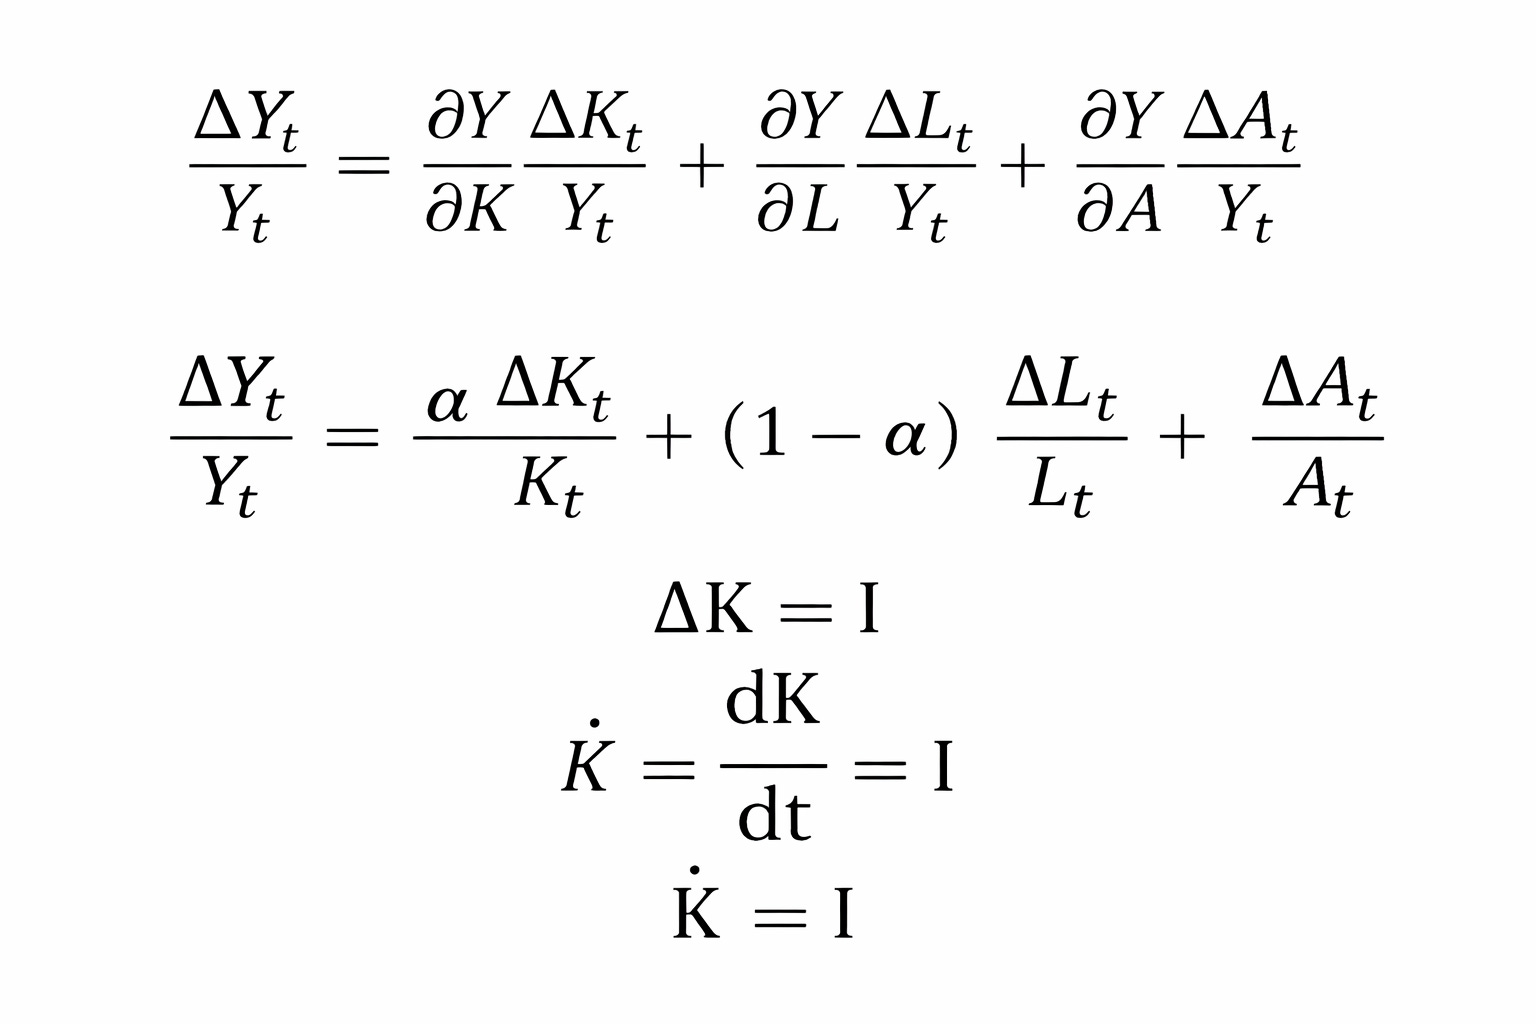
It follows from the production function that there are three principal determinants of output growth—capital, labour, and technological progress—and that GDP growth is driven by the joint expansion of these three factors. Consumption does not enter the model as an independent variable. Indeed, throughout the long historical period preceding the Industrial Revolution in Britain, economic growth was extremely slow. The reason is straightforward: labour productivity was so low that, apart from the output required to maintain simple reproduction and replace the means of production, virtually all output was consumed. Without the accumulation of means of production, there could, of course, be no sustained economic growth.
Clearly, then, economic growth is not driven by consumption, but by investment grounded in saving. Consumption can be said to “pull” economic growth only in the limited sense that, when effective demand is deficient, it helps offset the shortfall in demand. Consumption cannot increase an economy’s growth potential; it can only help ensure that growth potential is fully realised.
This does not imply any denial of the importance of consumption. Karl Marx observed that “Without production there is no consumption, but without consumption there is no production either, since in that case production would be useless”, but he also argued that “the expansion of production implies the conversion of surplus-value into additional capital, and thus also an expansion of the capital forming the basis of production.” By definition, the “expansion of the capital” is investment. Within a given period, consumption and investment are in a relationship of trade-off: more investment implies less consumption.
In the early years of the People’s Republic, for the sake of future generations, China tightened its belt, endured hardship, consumed less, and saved or invested more; the result was a decline in current consumption. Today, younger generations are more inclined to consume, and consumption accounts for a larger share. Consumption and investment, therefore, are not fundamentally opposed; the issue is one of intertemporal choice, and different choices reflect different social welfare functions.
In Capital and Interest, Eugen von Böhm-Bawerk developed the concept of roundabout production, arguing that the means of production, or capital goods, must first be produced before they can be used to produce consumer goods. Robinson Crusoe offers a simple illustration. At first, he catches fish with his bare hands and can secure only a few each day. He then makes a fishing net, raising his daily catch to as many as fifty fish. Later, he builds a raft, and then a fishing boat, and his catch rises substantially further.
In 1936, Soviet economist Grigory Feldman argued that if a larger share of capital goods is allocated to the capital-goods sector, that is, if more investment is directed towards the production of capital goods, then output in the consumer-goods sector will initially be lower. However, because output in the capital-goods sector expands more rapidly, the quantity of capital goods available for the production of consumer goods will also increase rapidly over time, even if the allocation ratio remains unchanged. As time passes, consumer-goods output will correspondingly expand, and may eventually catch up with, and surpass, the level that could have been achieved had a larger share of investment initially been directed towards consumer-goods production.
Should a society consume more now, or consume more in the future? Feldman’s model addresses precisely this question. One of its key variables is the allocation of investment goods. I denotes total capital goods, and I₁ the portion allocated to the production of means of production. Then r = I₁ / I denotes the share of investment goods allocated to Department I (production of means of production) in total capital goods. As the equation below shows, when t is small, a higher value of r implies a lower level of C. As time passes, however, a higher value of r implies a higher level of C. A lower value of r corresponds to “more consumption now, less later”, whereas a higher value of r corresponds to “less consumption now, more later”.
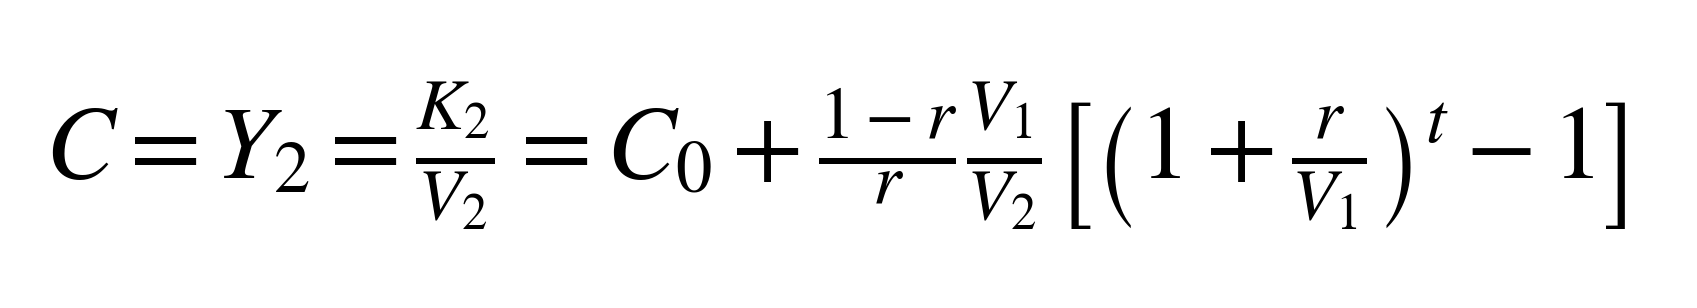
Here, C, Y, K, and V denote consumer goods, the output of Department II (production of means of consumption), capital, and the capital-output ratio, respectively. The subscripts 1 and 2 refer to the two departments.
In the long run, consumption and investment are not related by a simple either-or contradiction. The relevant choice is, rather, between consuming more in the present and consuming less in the present to consume more in the future. How that choice is made depends on collective preferences.
The stronger growth performance of East Asian economies relative to Western economies, and to those in Africa and Latin America, is to some extent closely related to the influence of Confucian culture, with its emphasis on family obligations, accumulation, and intergenerational transmission. East Asian economies tend to exhibit relatively high saving and investment rates, and they have also tended to grow more rapidly. Before reform and opening up, China faced a problem of forced saving, with both the consumption share and the level of consumption being excessively low. The situation today, however, is very different.
Some empirical studies suggest that the higher the share of net fixed capital formation in GDP, the higher the rate of GDP growth. In turn, the higher the rate of GDP growth, the faster the growth of consumption.
05 Correctly interpreting China’s consumption data
A common view holds that China’s consumption share is too low. But what is the actual situation?
Judging from the official data and from cross-country comparison, China’s consumption share is indeed relatively low. In 2023, for example, the consumption share in the United States was roughly 80–82 per cent, whereas in China it was 53–55 per cent; in other major economies, too, the consumption share was higher than in China.
However, such comparisons are complicated by differences in the composition of consumption. In the United States, services account for more than two-thirds of household consumption, whereas in China, per capita expenditure on services accounted for 43.2 per cent of per capita household consumption expenditure in 2022.
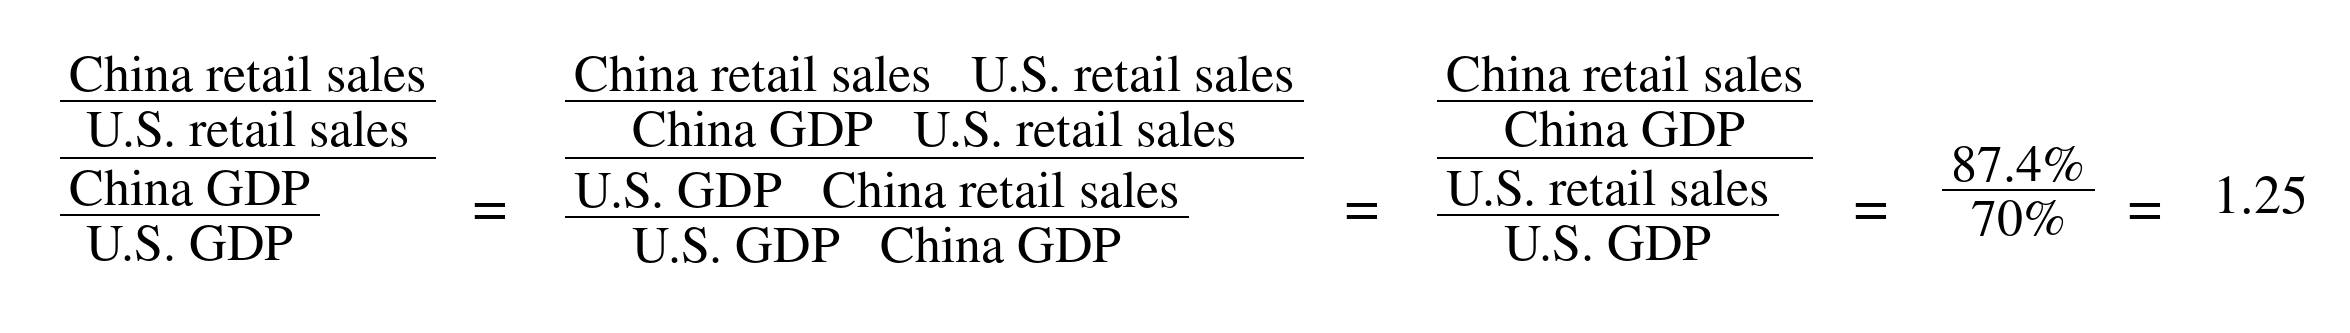
Compared with China, service prices in other countries are much higher, which is why their consumption ratios are substantially higher than China’s. Once these factors are excluded, China’s consumption ratio is indeed somewhat lower, but the gap may in fact not be very large. Judging from the ratio of goods consumption in final consumption to GDP in China and the United States, a simple calculation suggests that China’s ratio is 1.25 times that of the United States. In this sense, China’s consumption share is not exceptionally low.
China’s ratio of service consumption to GDP is clearly lower than that of the United States. How much of this difference reflects disparities in quantities, and how much reflects differences in prices, requires further analysis. Even so, ordinary observation suggests that service prices in the United States and other Western economies are substantially higher than those in China.
In practice, the level of consumption is a more important concept than the consumption share. Indeed, the countries with the highest consumption shares are often among the poorest in the world. In some African countries, the consumption share reaches, or even exceeds, 100 per cent. According to a 2021 World Bank report, once price adjustments are made, China’s consumption volumes in housing, education, recreation, and healthcare are roughly twice as large as those measured at market exchange rates. Judged by indicators of material consumption, the consumption level of Chinese households does not lag behind that of developed economies and, in some respects, may even exceed that of the United States, including caloric intake, protein intake, children’s height, urban living space, homeownership, years of schooling, luxury goods sales, and per capita meat consumption. Life expectancy in China also exceeds that in the United States: in 2021, it was 78.2 years in China, compared with 76.1 years in the United States.
Another common view is that the ratio of household disposable income to GDP in China is too low. The National Bureau of Statistics of China publishes two sets of data on household disposable income. The first is national household disposable income derived from household surveys; the second is reported in the Flow of Funds Table. For various reasons, the household survey data may be subject to systematic bias. Although the National Bureau of Statistics has adjusted these figures using tax data, household disposable income may still be understated in the official statistics. As the figure below shows, the discrepancy between the two series is substantial. In 2022, the gap between the household disposable income-to-GDP ratios derived from these two sources reached as much as 16 percentage points.
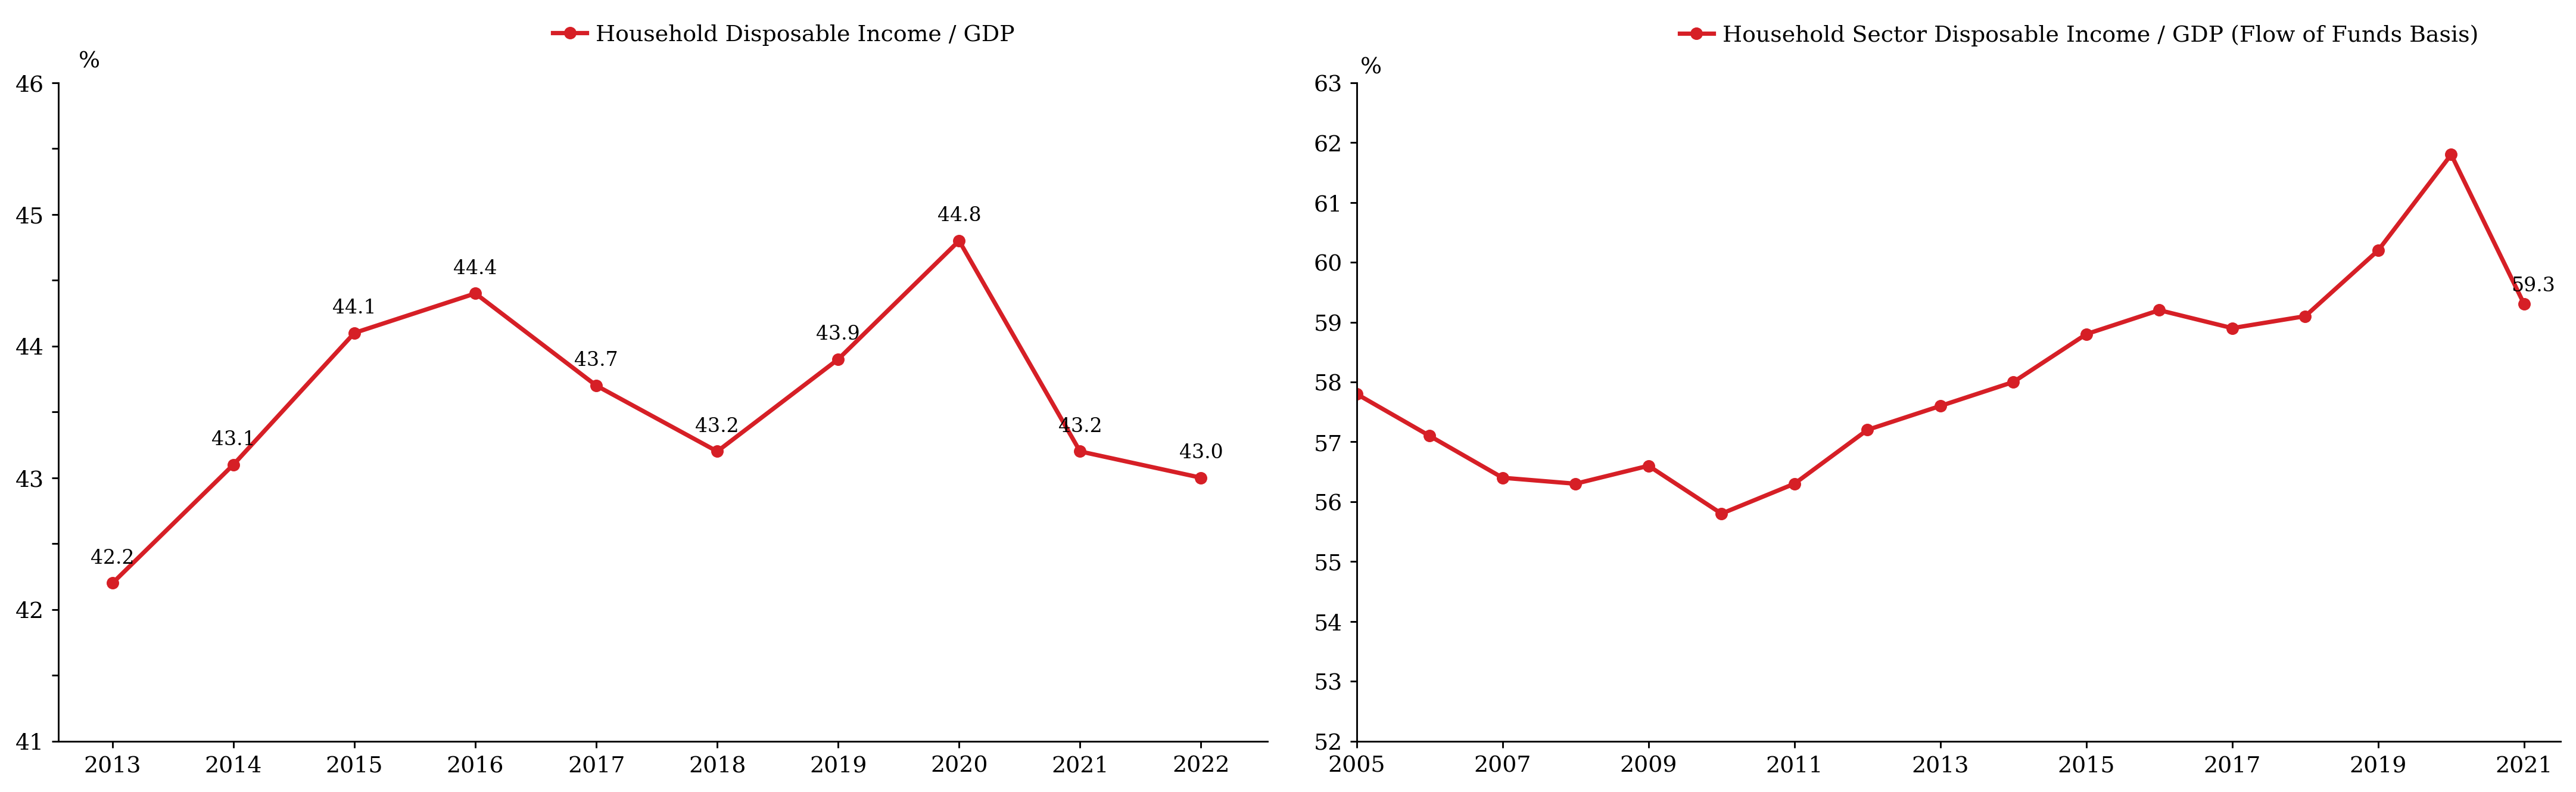
China’s ratio of household disposable income to GDP is lower than that of most developed economies, but the gap is not as large as some analyses suggest. For example, in 2022, the ratio of household disposable income to GDP was 56.22 per cent in Japan and 46.1 per cent in Denmark, both below China’s ratio as measured in the Flow of Funds Accounts; in the United Kingdom, the ratio was 61.47 per cent, only slightly above China’s.
Since national conditions differ, such simple comparisons are not, by themselves, sufficient to establish the point. Raising household disposable income generally implies reducing taxation, social security contributions, and related charges. Yet China’s aggregate tax burden is already in the lower-middle range among the world’s major economies. Thus, although China may consider further increasing the ratio of household disposable income to GDP, it is difficult to say how much scope there is for doing so.
Under the income approach, GDP = household disposable income + retained earnings and depreciation of enterprises + net government income. With GDP given, any increase in household disposable income must be matched by a reduction in one or both of the other two components.
As regards retained earnings and depreciation, firms require sufficient internal funds to support technological innovation. The fact that a large number of Chinese firms have achieved major technological breakthroughs in recent years is inseparable from their substantial investment. Depreciation also accounts for a relatively large share in China’s GDP statistics because China produces more than 30 per cent of global manufacturing output and remains the world’s largest manufacturing power; it is therefore natural that depreciation should exceed that of many other countries. The relatively high share of depreciation in GDP is related to the fact that manufacturing accounts for a much larger share of China’s economy than it does in most economies. Whether it is also related to a faster pace of technological upgrading requires further study. If China is to maintain its position as a major manufacturing power and continue to pursue technological innovation and technological revolution, the share represented by retained earnings and depreciation cannot be reduced.
Net government income = government revenue (including value-added tax and income tax) - government subsidies. The ratio of China’s fiscal revenue to GDP reached a low of 11.2 per cent in 1994. With the implementation of the tax-sharing reform, this ratio gradually rose to above 20 per cent, before falling to 16.29 per cent in 2024. Overall, China’s fiscal revenue-to-GDP ratio remains low by international standards; in developed economies, the comparable figure is generally in the range of 35 to 40 per cent.
In short, whether the Chinese government should further reduce taxes to raise the share of household disposable income, whether the share of retained earnings and depreciation should be lowered, and, if so, how this should be done, are all complex questions that require separate analysis. Without a detailed argument, it is rash to conclude, based on simple international comparison alone, that the share of household disposable income in China’s GDP is too low.
The principal problem in household consumption in China is the excessively wide gap in income distribution. Although China’s Gini coefficient has declined somewhat, it remains at a relatively high level. Professor Li Shi, Dean of the Institute for Common Prosperity and Development at Zhejiang University and one of China’s leading scholars of income distribution, stated at the 2024 annual meeting of the China Foundation Forum that over the past two decades, China’s income gap first widened, then narrowed, and has now broadly stabilised at a relatively high level. The Gini coefficient reached 0.491 in 2008, close to 0.5. If a country’s Gini coefficient exceeds 0.5, it is generally regarded internationally as exhibiting extreme income inequality. Before reaching that threshold, however, a turning point emerged, and the Gini coefficient entered a period of gradual decline. Yet the magnitude of this decline was limited, amounting to less than 3 percentage points over seven years. Since 2016, the Gini coefficient has fluctuated within a relatively stable range of 0.46 to 0.47, indicating that the income gap has shown no further tendency to narrow and has remained persistently high.
06 Effective paths to boosting consumption demand growth under insufficient effective demand
In the long run, consumption cannot drive economic growth. In the short run, however, when effective demand is insufficient, an increase in consumption demand can support economic growth.[1] When aggregate demand is inadequate, the GDP growth rate for a given year can be derived from the achievable growth rates of the various components of aggregate demand and their respective shares in GDP.
[Yu Yongding’s note: It should be emphasised that an increase in consumption does not raise output, aggregate supply, or productive capacity. Output, or productive capacity, in any given period, is determined by inputs undertaken in earlier periods. In the short run, under insufficient effective demand, an increase in consumption demand can bring existing productive capacity into fuller utilisation, so that actual output rises to potential output and the actual growth rate converges to the potential growth rate.]
GDP growth = (growth rate of final consumption × share of final consumption in GDP) + (growth rate of capital formation × share of capital formation in GDP) + (growth rate of net exports × share of net exports in GDP)
In 2024, China’s GDP grew by 5 per cent, with consumption, investment, and net exports, or the trade surplus, contributing 2.2, 1.3, and 1.5 percentage points, respectively. After Trump launched the trade war, I had expected China’s imports and exports to be severely affected. Unexpectedly, they rose sharply in 2024 and again recorded double-digit growth in 2025, becoming an important driver of economic growth. This pattern is inconsistent with China’s long-term development strategy and with the central authorities’ dual-circulation framework. It can only intensify trade tensions, provoke resentment abroad, and induce other countries to adopt protectionist measures. Economic growth in 2025 should rely primarily on the expansion of domestic demand, which mainly consists of consumption demand and investment demand.
Let me first make it clear that I personally support measures to boost consumption. Many scholars have put forward relevant proposals in this regard. Taken together, these can be grouped into three categories.
The first is the direct distribution of cash or consumption vouchers. Standard consumption theory holds that consumption is a function of income, income expectations, and wealth, or, put differently, of permanent income. If disposable income does not rise and expectations do not improve, it is difficult to achieve a sustained increase in household consumption. When a low-income household receives a temporary government subsidy, it may save a substantial portion of it as a precaution, because such income is transitory rather than permanent.
At a more microeconomic level, there is also the question of which goods should be targeted by vouchers or subsidies. In 2024, total retail sales of consumer goods in China rose by 3.5 per cent year on year. Among major categories, the sharpest decline was in the retail sales of gold and silver jewellery, followed by building and decoration materials, whereas essential consumer goods continued to record growth. Plainly, the government will not issue consumption vouchers or subsidies for high-end consumer goods. Subsidies for basic necessities, meanwhile, are unlikely to have a large effect on aggregate consumption demand. By contrast, the issuance of vouchers or subsidies for the purchase of electric vehicles and certain electronic products, in conjunction with industrial policy, has played an important role in stimulating consumption. Yet as market penetration of these products rises rapidly, and for other reasons as well, the effectiveness of such measures is gradually diminishing.
There is, of course, also a wealth effect: a decline in house prices reduces the consumption demand of homeowners, especially property investors. Under such circumstances, the impact of cash transfers and various forms of consumption vouchers on their consumption behaviour is likely to be limited. A further practical difficulty is that local governments have constrained fiscal capacity and are therefore unlikely to be able to sustain large-scale voucher programmes and subsidies over time. Moreover, the potential inflationary consequences of such policies in the future cannot be disregarded.
The second category is a reduction in personal income tax. There is no theoretical objection to this proposal, but its effect is likely limited. China’s annual personal income tax revenue is about RMB 1.45 trillion [$210 billion], while the size of the economy is roughly RMB 135 trillion [$19.6 trillion], so the relative weight of personal income tax is modest. Moreover, the relevant policy adjustment would not involve abolishing the tax altogether, but rather measures such as raising the exemption threshold or lowering marginal tax rates. The resulting income release would likely amount to only several hundred billion RMB, so its effect in stimulating consumption would probably be fairly limited.
The third category is reform of the social security system. There is, in fact, considerable scope for discussion in this area, but I will focus here only on the core proposal: lowering social insurance contribution rates. China’s social security system currently comprises five main programmes, including pension insurance for urban employees, pension insurance for urban and rural residents, minimum living allowances, medical insurance, and work injury insurance. Of these, the urban employees’ pension system is the most important.
Internationally, pension systems for urban employees generally fall into two broad categories: defined contribution schemes and defined benefit schemes. China’s current system combines features of both and is a hybrid model.
The core logic behind calls to lower contribution rates, for example, from 20 per cent to 12 per cent, is that releasing part of current income would help stimulate household consumption. Yet this proposal raises several complex issues.
First, the scale of any rate reduction would need to be estimated carefully: how much income would be released by each 1-percentage-point cut, and what share of that income would actually be translated into consumption rather than saved?
Second, there is a clear intertemporal trade-off. Social insurance contributions follow the actuarial principle that higher contributions are associated with higher benefits. If the contribution rate were reduced only modestly, the additional income released for consumption would be limited. If it were reduced substantially, however, future pension payments might be affected. Whether some form of Ricardian-equivalence effect may arise here is worth considering.
Third, the responses of high-, middle-, and low-income groups to a reduction in contribution rates would differ, adding further uncertainty to the policy’s effects.
Fourth, any reduction in contribution rates would most likely have to be implemented gradually and would therefore be unlikely to generate a significant boost to consumption in the short run.
The urban employees’ pension system is actuarially grounded and functions, in effect, as a form of implicit contract. It is therefore difficult to adjust, slow to reform, and unlikely to be altered substantially in the short term. Even so, two areas within the social security system remain open to policy improvement.
The first is the pension scheme for urban and rural residents. In substance, this is not a purely insurance-based system, but rather a social welfare arrangement financed predominantly by the government, with 80 to 90 per cent of funding coming from public finances. At present, average monthly benefits for farmers are only around RMB 100 to 200 [$14.5-29], which is clearly too low and ought to be raised.
The second is the minimum living allowance system. Current benefit levels are likewise low, and although the urban-rural gap in minimum living allowances is less pronounced than that in pension provision, there remains room for improvement. The precondition for either reform, however, is additional government funding. How to finance such measures is the key issue for implementation.
Overall, all three of the above proposals for boosting consumption have positive aspects, but each requires rigorous actuarial analysis and empirical study before its likely effects can be properly assessed. Their practical effectiveness, therefore, remains uncertain. In short, household income, income expectations, and wealth, or in other words, permanent income, are the key determinants of consumption behaviour. Only a stable rise in permanent income can deliver sustained growth in consumption.
How, then, can permanent income be increased? Under current conditions, the most feasible path is to raise the growth rate of infrastructure investment. A given increment in infrastructure investment can be converted immediately into an equivalent increase in income for firms and households. The resulting increase in household income leads, in turn, to higher household consumption expenditure. At the same time, government investment will generate a crowding-in effect, inducing an increase in private investment expenditure. Through the multiplier process, the resulting increase in consumption and investment expenditure gives rise to a further round of income growth, which in turn supports a further expansion of consumption demand and investment demand. In this way, infrastructure investment can ultimately help close the shortfall in effective demand.
07 China’s infrastructure investment is far from saturated, and its efficiency should be evaluated comprehensively
Two common doubts are raised with respect to infrastructure investment: first, that it has already reached saturation; and second, that its efficiency is too low. The first point that must be made clear is that China’s infrastructure is far from saturated.
Consider first the transport network. China’s transport infrastructure is highly developed, but it remains incomplete. For example, China has only a few hundred small airports, whereas the United States has more than ten thousand. The disparity is enormous, indicating considerable room for further development in aviation infrastructure. Intercity rail transit, likewise, remains far from sufficient to meet the needs of economic development.
Consider next urban public lighting and communications networks. Even today, just outside my own residence, one can still see hundreds of electrical wires hanging in a chaotic tangle. This exposed and disorderly form of installation poses serious risks. In the event of strong winds or other severe weather, it may not only lead to widespread disruption of electricity and communications, but also create major safety hazards.
The gap is even more evident in underground utility networks. I took this photograph of a sewer in Milan myself, lying on the ground to do so. Although it does not appear especially deep in the photograph, its actual depth is more than ten metres, and this project was completed more than a century ago.
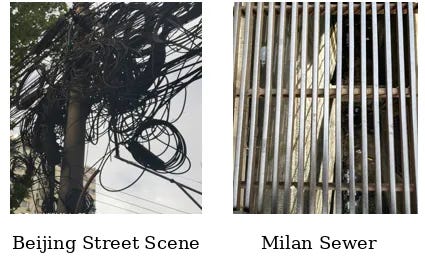

From airports and air routes to underground utility networks, all these examples suggest that China continues to lag significantly behind developed economies in the quantity, quality, and planning philosophy of infrastructure development. There remain many areas in which catch-up is needed. The claim that infrastructure investment has already reached “saturation” is therefore clearly untenable.
The scope for further infrastructure investment in China remains very large. Take the energy network as an example. As Zhu Yunlai has observed, “Northwestern China possesses uniquely favourable solar resources. The region enjoys abundant sunshine, and much of its terrain consists of flat Gobi desert with, for the time being, relatively little alternative economic value, making it exceptionally well-suited to the construction of large-scale photovoltaic bases. A transmission line 3,000 kilometres long can deliver 200 million kilowatt-hours of electricity per day. China’s average daily electricity consumption is about 27.4 billion kilowatt-hours. In principle, 100 such transmission lines would be sufficient to meet nationwide electricity demand. At present, the cost of photovoltaic power generation has fallen sharply, and total system costs are only about half those of thermal power. In addition, advances in battery storage may make it possible for photovoltaic power to provide a stable, round-the-clock supply.”
Some reports also suggest that the infrastructure investment required for urban underground drainage systems alone could amount to as much as RMB 4.5 trillion [$652.5 billion]. Many studies conclude that China still has very substantial room for infrastructure investment in areas such as energy, electricity, and communications.
During the Fifteenth Five-Year Plan period, the government could consider further advancing the Western Development Strategy by extending large-scale infrastructure investment into Central Asia along the Hexi Corridor and establishing a corresponding economic corridor. Central Asia occupies a pivotal position in the centre of the Eurasian landmass, linking the continental heartland with its surrounding regions. Connecting the Western Development Strategy with the construction of a Central Asian economic corridor would be of considerable significance, both for stimulating domestic demand and for strengthening China’s domestic security and geopolitical position.
During a recent field visit to northwestern China, I was struck by the region’s vast land area, favourable natural conditions, and abundant underutilised space, all of which point to substantial potential for further development. From a geopolitical perspective, such a strategy carries even broader significance. In the past, strategic competition centred on sea power and rights of passage. Today, China could revive the pioneering spirit of Zhang Qian’s mission to the Western Regions by opening a corridor running through Xinjiang, Kyrgyzstan, Uzbekistan, Turkmenistan, and other neighbouring countries and regions, thereby turning the west into a secure strategic hinterland for national development.
At present, China possesses ample supplies of steel, cement, and other construction materials, as well as a large stock of idle production equipment, all of which could provide strong support for infrastructure construction in the western region and across borders. Whether in the transport networks and public-service facilities of the northwest, or in the improvement of basic infrastructure in Tibet, there is no shortage of investment projects that could be implemented on a large scale. It is reasonable to assume that the central authorities have already given consideration to such a strategic configuration.
The central authorities have recently introduced the “Two Major Tasks 两重”—the implementation of major national strategies and the building of security capacity in key areas. The latter encompasses such critical fields as food security, energy security, industrial and supply-chain security, and national defence security. This policy framework is both strategic and forward-looking.
I will not dwell here on the “Two New 两新” initiatives (new types of infrastructure and a new type of urbanisation), since the central authorities have already introduced a series of policy measures in these areas. As a member of the National Planning Advisory Committee from the Eleventh to the Fifteenth Five-Year Plans, I would particularly like to see a comprehensive list of investment projects under the “Two Major Tasks” and “Two New Developments.” I have asked the relevant departments whether such a list might be made available for consultation, but it remains unclear whether it can be disclosed publicly.
[Yuxuan’s note: Yu Yongding’s reference to the “Two New 两新” initiatives reflects an earlier policy usage from former Premier Li Keqiang’s 2020 Government Work Report, where “Two New and One Major 两新一重” referred to new types of infrastructure, a new type of urbanisation, and major transportation and water conservancy projects. Since 2024, however, official usage has shifted. In February 2024, Xi Jinping called for a new round of large-scale equipment renewal and trade-in of consumer goods, and subsequent government measures institutionalised this agenda with substantial fiscal support. In current official policy discourse, “Two New 两新” now generally refers to large-scale equipment renewal and consumer-goods trade-in, and it is often paired with the “Two Major Tasks 两重,” which first appeared in the 2024 Government Work Report.]
In fact, the project pipeline is ample. Looking back at the response to the global financial crisis in 2008–09, local governments competed vigorously to secure project approvals from the National Development and Reform Commission (NDRC). Officials at the time noted that many projects previously set aside were reactivated and accelerated in order to offset the impact of the crisis. Although implementation inevitably gave rise to some problems, project rollout was exceptionally rapid.
What is needed now is an early release of the investment project list under the “Two Major Tasks” and “Two New” initiatives. During a recent visit to the Yalong River, I observed that along a stretch of little more than ten kilometres, the vertical drop reached several thousand metres, with more than twenty power stations distributed along the route. Western China possesses many such advantages for clean energy development. China enjoys exceptionally favourable conditions for infrastructure and energy project construction.
As for the returns to infrastructure investment, some argue that projects lacking profitability should not be undertaken, since they would merely generate losses. This view is mistaken. Infrastructure projects are characterised by their foundational, public-interest, and long-term nature. Their public character means that their primary objective is social benefit rather than commercial profit alone. Because markets tend to underprovide such investment, government leadership or support is often necessary.
China’s high-speed rail system provides a clear example. Had commercial returns been treated as the overriding criterion, the high-speed rail network would never have reached its current scale. In practice, the network has transformed China’s economic and social life and become one of the country’s most visible national achievements. Some lines do, admittedly, have low occupancy rates. But this is a common feature of public infrastructure: the core purpose of public services is to meet aggregate social needs rather than maximise a single measure of commercial return.
During research in the United Kingdom, I made a point of observing rail operations. On a 10 a.m. train from Kent to London, many carriages were almost empty; during the morning and evening peaks, however, trains were overcrowded. This tidal pattern of use means that public infrastructure cannot maintain high utilisation rates at all times, and its value cannot be assessed solely in terms of commercial profitability. The efficiency of infrastructure investment should therefore be evaluated not only in terms of short-term economic returns, but also in light of its long-term social returns and broader social significance.
At the same time, however, it must also be recognised that infrastructure investment has indeed problems such as duplicative construction, resource waste, and low efficiency. In fact, the relevant authorities are acutely aware of these issues. On 25 December 2024, the General Office of the State Council issued the Negative List for Local Government Special-Purpose Bond Projects, establishing clear red lines for infrastructure investment. As for inefficient and wasteful projects that have already been completed, there is little to be gained from dwelling on the past. What matters more is to proceed from present realities: to use the negative list as a benchmark, tighten scrutiny over the approval of new investment, direct subsequent investment towards areas of genuine need and value, and avoid repeating earlier mistakes.
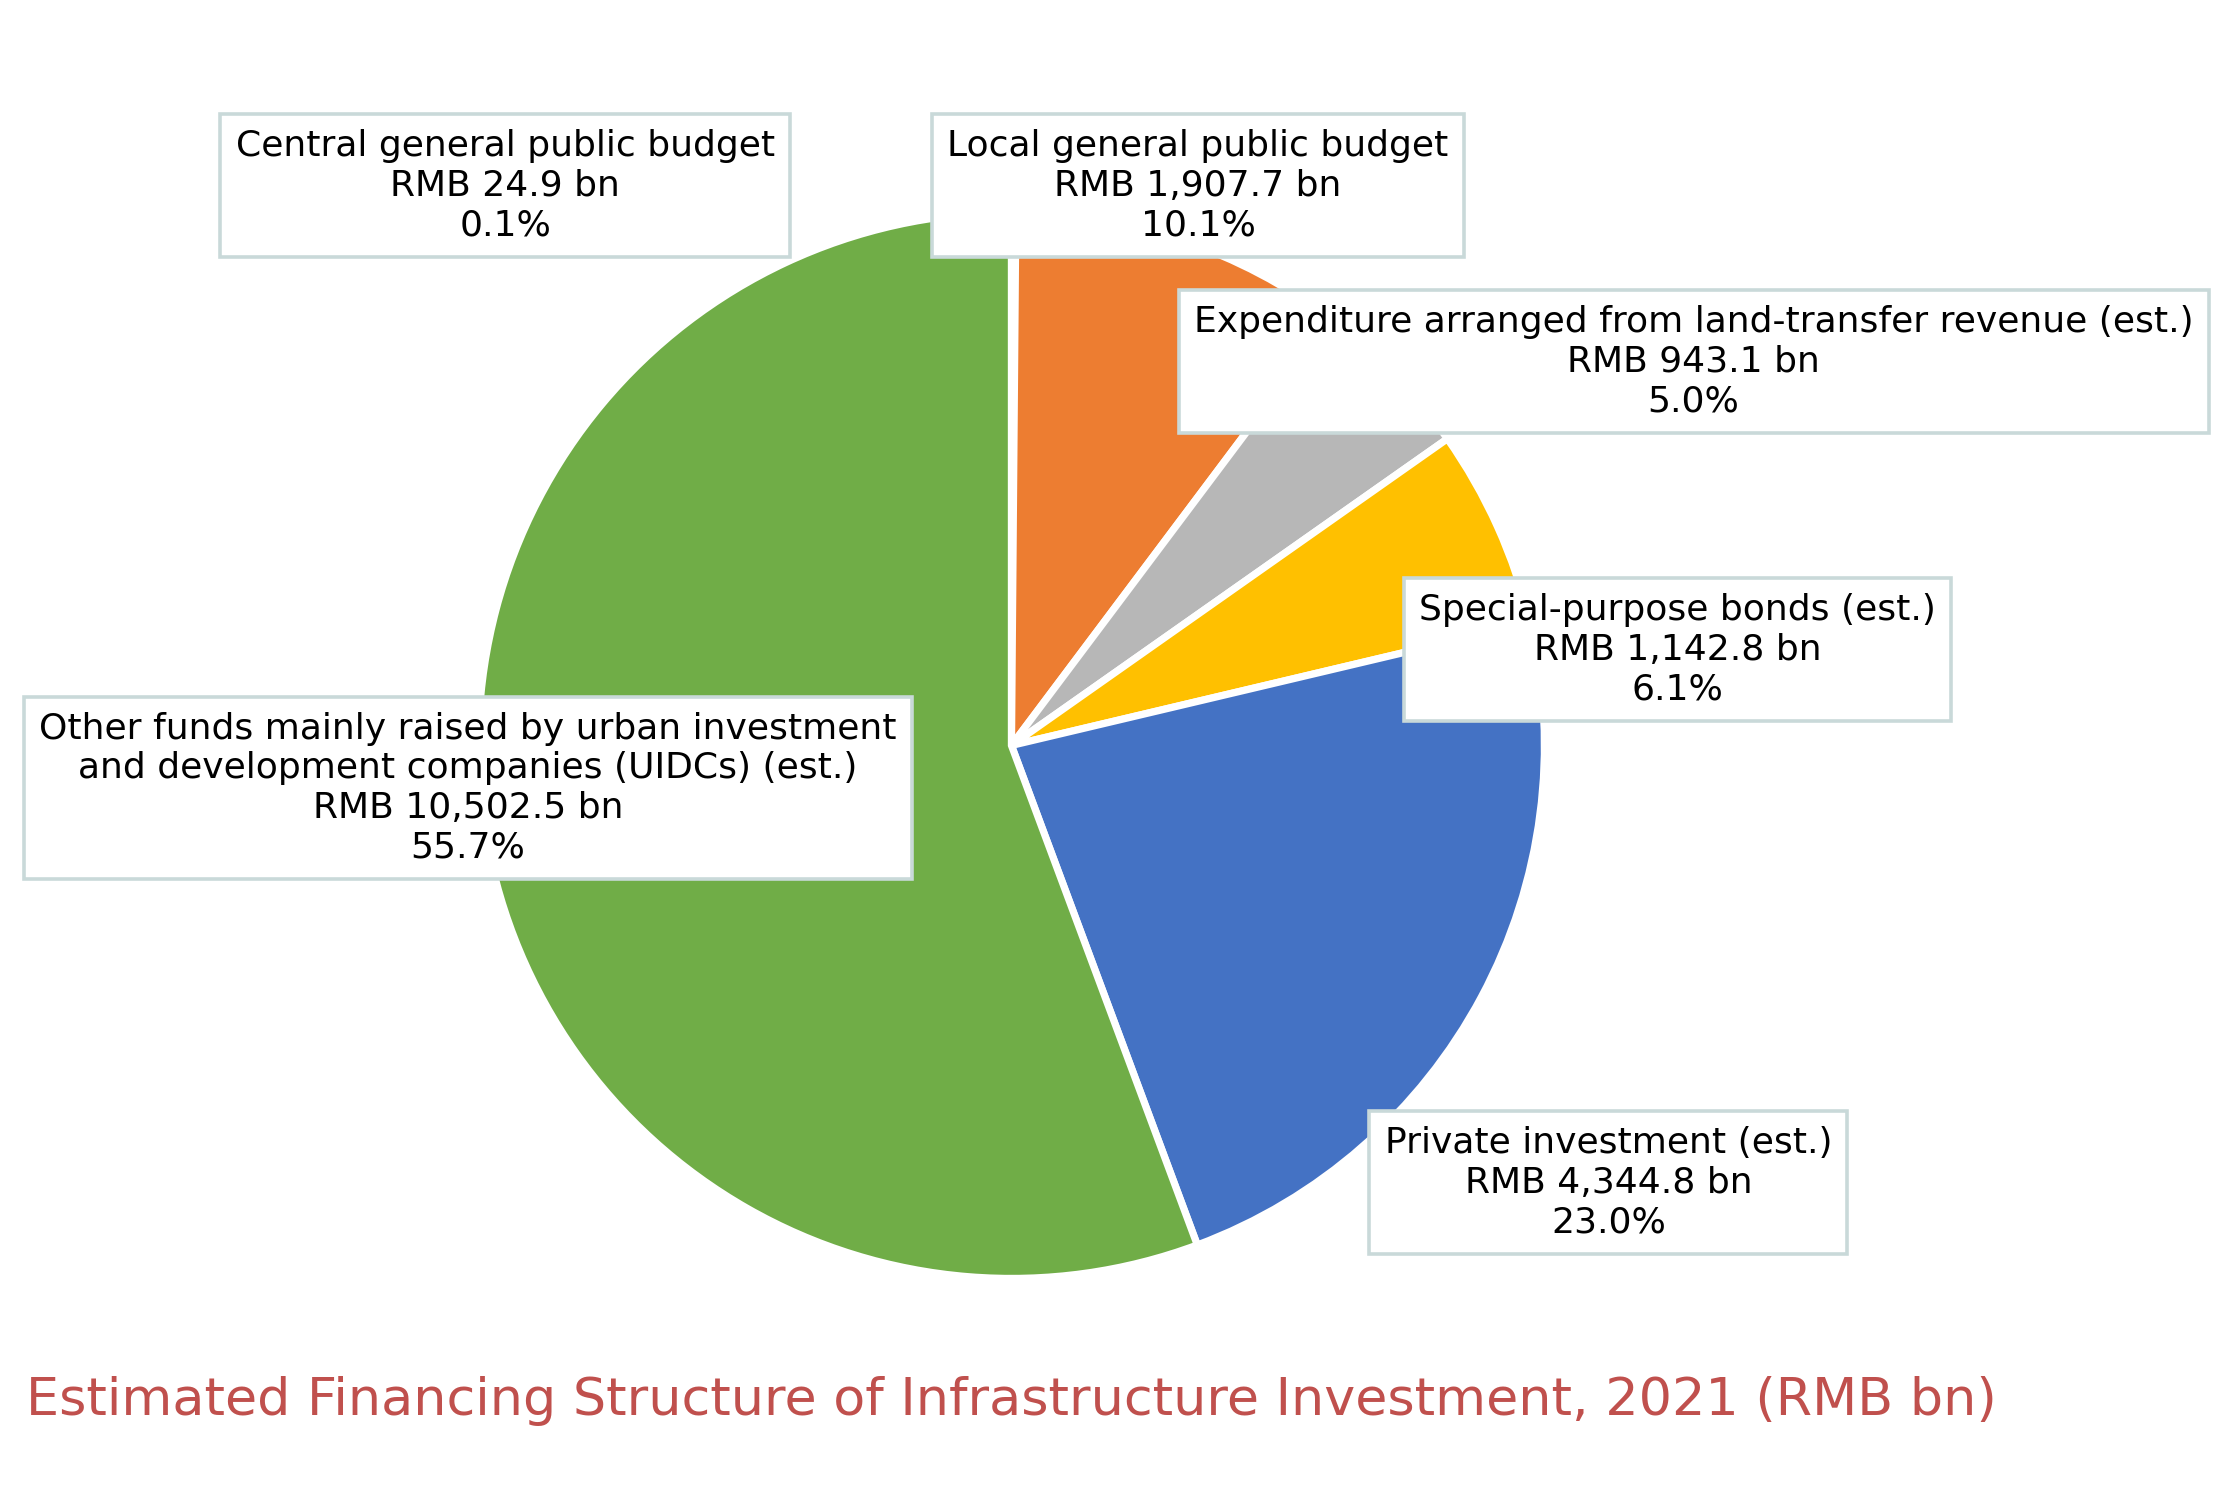
Beyond the availability of projects, a central problem facing infrastructure investment at present is the lack of funding. In my view, since the 2009 RMB 4 trillion stimulus package, the contribution of the central government’s general public budget to infrastructure financing has been far too limited. Responsibility for infrastructure construction generally rests with local governments. Even where major projects are coordinated by the centre, the concrete burden of financing usually falls on local authorities.
Looking back at the 2008 RMB 4 trillion stimulus package, the central government directly contributed RMB 1.18 trillion in fiscal funds. By 2021, however, central support for local infrastructure investment had fallen to only RMB 24.981 billion, accounting for just 0.1 per cent of total infrastructure investment that year, a virtually negligible share. With insufficient central funding, local governments have had little choice but to raise funds through multiple channels to push projects forward. Among these channels, the share of low-cost financing, such as bank lending, has been limited, whereas the share of high-cost financing, such as trust financing, has been relatively high. Combined with the waste and low efficiency observed in some local infrastructure projects, this has made the accumulation of debt risks all but inevitable. This is a major issue in infrastructure investment that must be squarely confronted and resolved.
Moreover, the Ministry of Finance has imposed increasingly stringent constraints on local government indebtedness. Under the Ministry’s definition, the local government debt ratio is calculated as outstanding local government debt divided by comprehensive fiscal capacity, where the latter includes general public budget revenue, government-managed funds budget revenue, and income from state-owned assets, among other items. In many regions, this ratio has already risen into the range of 120 to 200 per cent, and in some cases has exceeded 300 per cent.
The debt ratio, therefore, places tight constraints on local governments’ ability to raise debt financing. On 29 January 2022, the Ministry of Finance classified debt risk into four categories based on the debt ratio: red (debt ratio above 300 per cent), orange (200–300 per cent), yellow (120–200 per cent), and green (below 120 per cent), in descending order of risk.
[Yuxuan’s note: According to available reports, by 2019, China’s Ministry of Finance had established a risk-rating system for local government debt based on debt-ratio thresholds, under which jurisdictions were classified into four categories—red, orange, yellow, and green. The framework became especially consequential in early 2021, when bond regulators and self-regulatory bodies reportedly began to use these categories as a reference for imposing differentiated constraints on Local Government Financing Vehicle (LGFV) bond issuance. It remains unclear to me why Yu Yongding cited 29 January 2022.]
Strengthening debt risk monitoring is entirely necessary. At the same time, however, the accountability system linked to these debt thresholds has significantly weakened local governments’ incentives to raise financing for infrastructure investment. This raises an important question: should the debt ratio thresholds be adjusted to reflect differing levels of economic development across regions? How to strike a balance between rigorous debt risk control and the legitimate financing needs of infrastructure investment is a central policy challenge at present.
Measured by the ratio of local government debt to central government debt, China’s figure stands at 138 per cent (RMB 47.54 trillion relative to RMB 34.57 trillion in 2024), compared with less than 10 per cent in the United States, 16–17 per cent in Japan, 10 perc ent in France (230.4 relative to 2,202.0 in 2022), and an even lower ratio in the United Kingdom. The increase in central government transfer payments to local governments in 2025 is a step in the right direction. Consideration should also be given to reforming China’s fiscal system, particularly the allocation of revenues and responsibilities between the central and local governments, to strengthen local fiscal capacity.
China should adjust the debt structure between the central and local governments and significantly increase the share of central government bonds in total general government debt. The specific mechanisms for doing so can be discussed separately. In infrastructure finance, in particular, the contribution of the central budget should be raised substantially. The central government should also repay, as soon as possible, the debts incurred during the pandemic that ought properly to have been borne by the centre but were in fact serviced by local governments.
08 The key lies in fiscal sustainability rather than fiscal balance
The Chinese central government has long adhered to a principle of fiscal prudence, and that stance is worthy of recognition. But the logic governing central government finance is fundamentally different from that of local governments and households. Households and local governments must, by necessity, live within their means. The central government, by contrast, should focus on fiscal sustainability rather than fiscal balance.
At present, China still retains substantial fiscal policy space. Yet for many years, the rule that “the deficit ratio must not exceed 3 per cent” has been treated by many as a red line. In fact, this benchmark has no direct connection to China’s own national conditions. It emerged after the establishment of the European Union as a means of constraining fiscal expansion in Southern European member states and preventing excessive spending that might ultimately require support from others. The rule itself has no particular theoretical foundation.
Japan’s experience further illustrates the limitations of conventional fiscal rules. In 1996, Japan’s fiscal deficit stood at about 5 per cent of GDP, while government debt amounted to 91 per cent of GDP. The Hashimoto government concluded that Japan’s public finances were approaching collapse and responded with austerity measures, including cuts in fiscal expenditure and an increase in the consumption tax. The result was a severe recession in 1998. Today, Japan’s government debt has risen to around 250 per cent of GDP. Although economic growth has remained weak, no fiscal collapse has occurred. Experience thus suggests that traditional fiscal indicators can be seriously misleading when treated in isolation.
Fiscal sustainability ultimately depends on demand for government bonds. If investors have confidence in a country’s prospects and future development, they will willingly purchase government debt, thereby driving yields lower. Conversely, when market confidence is weak, governments can only attract investors by offering sharply higher yields, as occurred during the European sovereign debt crisis, when yields on Greek ten-year government bonds once rose to 44 per cent. At present, the yield on China’s ten-year government bonds is only 1.7 per cent, and at one point fell as low as 1.5 per cent. These low yields reflect strong market confidence in the Chinese economy and suggest that China still has considerable room for fiscal policy manoeuvre.
Following my visit to Japan, I identified a regularity: the ratio of government debt to GDP tends to converge to the limiting value given by the deficit ratio divided by the GDP growth rate. For example, if the deficit ratio is 3 per cent and GDP growth is 5 per cent, the limiting value of the debt-to-GDP ratio is 60 per cent. I later learned that European policymakers at the time assumed that euro area growth would reach 5 per cent. Once the deficit ratio was capped at 3 per cent, it followed directly that the limiting value of the debt-to-GDP ratio would be 3/5, or 60 per cent. This is how the 60 per cent debt ceiling was derived. It is therefore clear that the 3 per cent deficit rule and the 60 per cent debt rule are not universal fiscal laws.
Conversely, if economic growth is zero, the limiting value of the debt-to-GDP ratio becomes unbounded; the higher the growth rate, the lower this limiting value. In 2001, China debated whether to adopt an expansionary fiscal policy. At the time, I firmly supported such a policy, although some argued that, once non-performing debt was taken into account, China’s debt-to-GDP ratio was in fact above the officially reported figure of 12 per cent and that the fiscal deficit should therefore not be expanded further. My conclusion, derived from the model, was that regardless of how high the current debt-to-GDP ratio may be, that ratio is merely the initial condition in the solution to a differential equation. So long as the deficit ratio can be kept at around 3 per cent and GDP growth maintained at around 7 per cent, China’s debt-to-GDP ratio would remain below 50 per cent and thus well within a safe range. The interest rate and the growth rate are the two key variables determining fiscal sustainability.
China’s fiscal position is fully sustainable. With inflation currently very low, the government should adopt a more expansionary fiscal stance, raise the deficit ratio, and issue additional government bonds, especially long-term bonds, to finance infrastructure investment, eliminate deflationary pressures as quickly as possible, and achieve growth of around 5 per cent. Excessive caution and hesitation would be costly. If inflation were to worsen for some reason, such as an energy shock, China’s policy space would narrow rapidly, making it far more difficult to rely on expansionary fiscal and monetary policy to stimulate growth. In that event, the economy would face a much more complex and severe set of challenges.


Why RMB internationalization is neither easy nor urgent

The internationalization of the RMB and its perceived challenge to the USD's dominance have been hotly debated topics. However, two prevalent misconceptions persist. The first is an underestimation of the obstacles, and the second is an overestimation of the priority Beijing assigns to this endeavor. These misconceptions are interlinked. While Beijing i…
 | A guest post by
|
Very interesting perspective. Thank you for sharing it. This passage was striking:
"The efficiency of infrastructure investment should therefore be evaluated not only in terms of short-term economic returns, but also in light of its long-term social returns and broader social significance."
Evaluated through that broader lens, a lot of investments that appear uneconomic may, in fact, be quite positive and sensible.
Much of the concern among economists abroad and within China, is not altruistically motivated. If it were, this interest in China rebalancing her economy in favour of consumption would be touching. Instead it (this concern) is inspired by an attempt to refocus China’s attention from production for exporting to production for domestic consumption — thereby resuscitating the prospect of manufacturing in America, Europe, Japan and others, who simply can’t compete as they once did. Hopefully, their yearning for the captive markets of imperialist times is destined to go unsatisfied.