1997 vs 2023: chartering the changes in deflationary trends
Guan Tao, formerly serving at the State Administration of Foreign Exchange looks to the present and future after analysis on the Asian Financial Crisis
Today’s piece, originally published under the title How is the current macro landscape different from the 1997 Asian Financial Crisis?与亚洲金融危机时期相比,当前宏观形势有何不同 is a sequel to the article posted on The East is Read the week before last:
Both are written by the same author, Guan Tao, former Director-General of the Balance of Payments Department, State Administration of Foreign Exchange (SAFE) of China. He is now Chief Economist with BOCI Securities Limited, Co-Founder of China Finance 40 Forum (CF40), and Professor at Dong Fureng Institute of Economic and Social Development at Wuhan University.
Deflationary trends, unemployment crisis, weakening currency, and natural disasters — China today much parallels how it was 25 years ago. Guan Tao illustrates not only the striking resemblances, but also the nuances, lessons, and prospects for the Chinese economy.
The article was originally published on Yicai Daily, on Aug. 15. It is also available in Guan Tao’s personal WeChat blogpost.
For China, 2023 marks officially the first year of post-pandemic normalization. The end-July meeting of the Political Bureau of the Communist Party of China (CPC) Central Committee noted that “after a stable transition in pandemic prevention and control, the economic recovery has been a process of ups and downs.” In the past six months or so, the magnitude of economic fluctuations and changing expectations has been on a scale rarely seen before. In the face of insufficient domestic demand, corporate operational difficulties, weakening external demand, and more risks lurking in key areas, a multitude of opinions have arisen across all parts of society. The internal and external environment China faced during the Asian Financial Crisis in the late 1990s may offer more relevant lessons today.
The external environment grows more complex and challenging
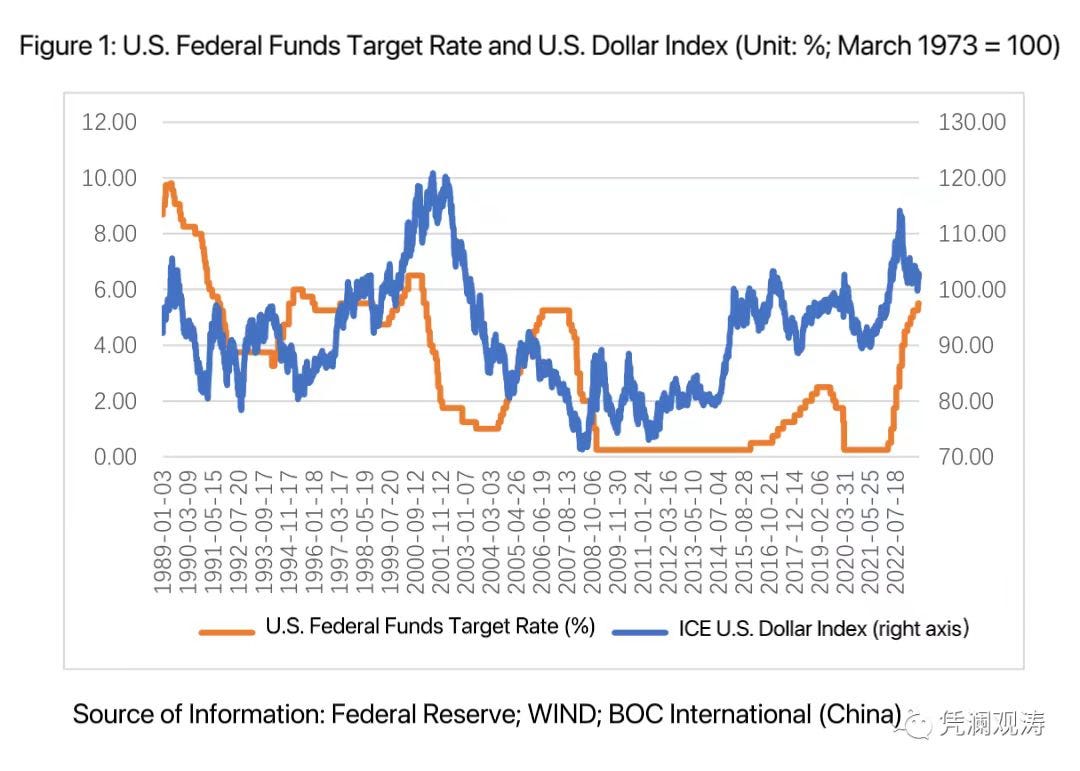
Like in the Asian Financial Crisis, the Federal Reserve (Fed) is tightening policy. The Fed's monetary tightening from the late 1980s to 1990s was a major external trigger for the Asian Financial Crisis. From June 1989 to September 1992, the Fed slashed rates 24 consecutive times, driving the federal funds rate down from 9.81% to 3%, fueling hot money flows into emerging markets like Southeast Asia.
Starting in February 1994, the Fed pivoted toward tightening, hiking rates 7 straight times, lifting the federal funds rate to 6% by February 1995. Although Fed policy oscillated between 1996-1997, rates stayed above 5%. This spurred hot money outflows from Asian emerging markets, sparking the Southeast Asian currency crisis in the second half of 1997, which morphed into the sweeping Asian Financial Crisis.
In 1998, amid the crisis peak, the Fed conducted three preemptive cuts, but had to tighten again given worries about U.S. inflation and stock "irrational exuberance." From June 1999 to May 2000, it hiked rates six consecutive times, totaling a 175 basis point increase (see Figure 1).
Pledging to not devalue the RMB against the dollar and improve currency management, China pursued proactive fiscal policy and prudent monetary easing to sustain growth. From October 1997 to February 2002, China slashed rates six consecutive times, driving the 1-year RMB deposit benchmark from 7.47% to 1.98%, and cutting the reserve requirement ratio twice, from 13% to 6%. From July 1998 to October 2001, China's benchmark deposit interest rate stayed lower than the U.S. federal funds rate, mounting pressure on the RMB.
As before, the U.S. dollar is strengthening. The dominance of the dollar in the late 1990s was clear, especially after the then Treasury Secretary of the U.S., Robert Rubin, promoted a strong dollar policy in 1995. From early 1995 until the Fed finished hiking in May 2000, the Dollar Index climbed 22.4% cumulatively, with the largest gain reaching 39.6%. Although the Index pulled back nearly ten percentage points during brief Fed cuts in September-October 1998, the U.S. economy would not allow a policy pivot (see Figure 1)
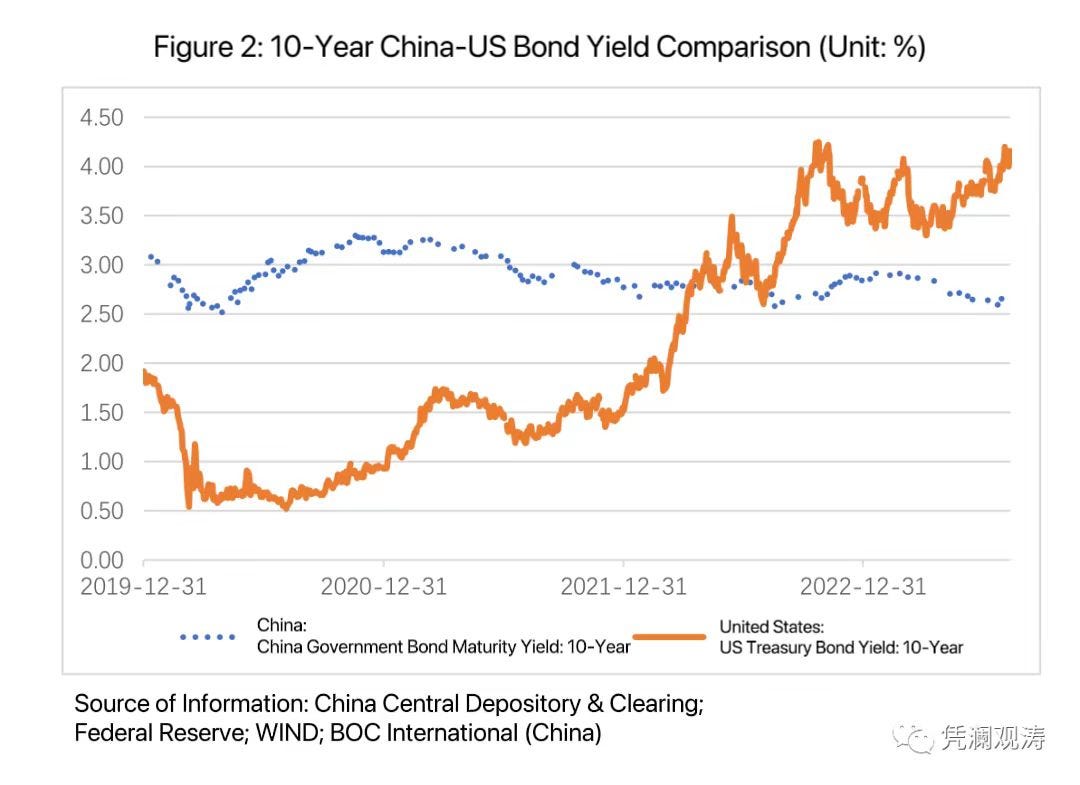
The recent round of aggressive Fed hikes drove the Dollar Index to a post-Asian Financial Crisis high by late September 2022. Then, as market expectations for easing jumped the gun, the Index rapidly retreated, falling by about 12.6% (see Figure 2). The point is the exchange rate and the Fed policy both hinge on economic fundamentals. For now, the economic fundamentals of the U.S. seem resilient. The GDPNow model projects 4.1% annualized Q3 GDP growth. According to Bloomberg economist forecasts, the U.S. still has the best medium and long-term prospects among developed economies. If the U.S. economy suddenly weakens, it may be difficult for the dollar to remain strong. However, unless there are major economic issues and significant unemployment rises, the Fed may maintain a hawkish tone even if it starts discussing or actually makes rate cuts in 2024.
This time, external monetary tightening is more aggressive. With four-decade high inflation, the Fed hiked rates 10 straight times from March 2022 to May 2023, took a breather in June, then added another 25 basis points in July, totaling 525 cumulative basis points (see Figure 2). Moreover, US inflation may prove stickier than expected. In July 2023, unemployment was 3.5%, near historic lows and well under the 4.4% natural rate of unemployment or, the nonaccelerating inflation rate of unemployment (NAIRU), estimated by the Congressional Budget Office (CBO). This echoes 1999 when the Fed restarted hikes and tightened labor market, resulting in negative employment gap and fueling core inflation.
China sticks to independent monetary policy, and since late 2021 has steadily injected stimulus “to keep the economy operating within an appropriate range”. By July 2023, the benchmark deposit interest rate has been trimmed 5 straight times, now 1.25 percentage points lower. The reverse repurchase agreement (RRP) and 1-year Medium-term Lending Facility (MLF) rates have been reduced three consecutive times, for seven cumulative days, by 30 basis points each. The 1-year loan prime rate (LPR) has been lowered three straight times, now 30 basis points cheaper. The 5-year LPR has been cut four times, down 45 cumulative basis points. With divergent Chinese and US monetary trajectories, the interest rate spread has flipped from positive to negative, with the negative gap continuing to widen (see Figure 2).
This time, the economic landscape is reversed. Emerging markets sustained the major blow during the Asian Financial Crisis. IMF data shows when the 1997 crisis hit, the real GDP growth of emerging economies, where the risks originated, slipped 0.2 percentage points from 1996 to 5.0%, whereas global and advanced GDP growth rate rose 0.3 and 0.6 percentage points respectively. In 1998, emerging economy growth plunged 2.7 percentage points, versus a 0.9 percentage point drop in advanced economies.
This time, advanced economies have suffered more. The IMF's latest World Economic Outlook shows 2023 real growth in over 90% of advanced economies will undershoot 2022, declining 1.2 percentage points to 1.5%. Emerging economies, meanwhile, will remain steady at 4.0%, and Asian emerging economies will rise 0.8 percentage points to 5.3%. Meanwhile, the IMF expects advanced economy growth to slide further 0.1 percentage points in 2024, whereas emerging economies improve 0.1 percentage points. Against this backdrop, external demand has dragged on China's growth for three straight quarters from Q4 2022 to Q2 2023.
This time, intensifying major-country rivalry poses more concerns. In the 1990s, China and U.S. pulled in the same direction in terms of economy and trade, with disagreements in certain areas. Overall, cooperation outweighed competition. China needed the WTO entry to boost exports, and the U.S. wanted China in global supply chains as a new growth engine.
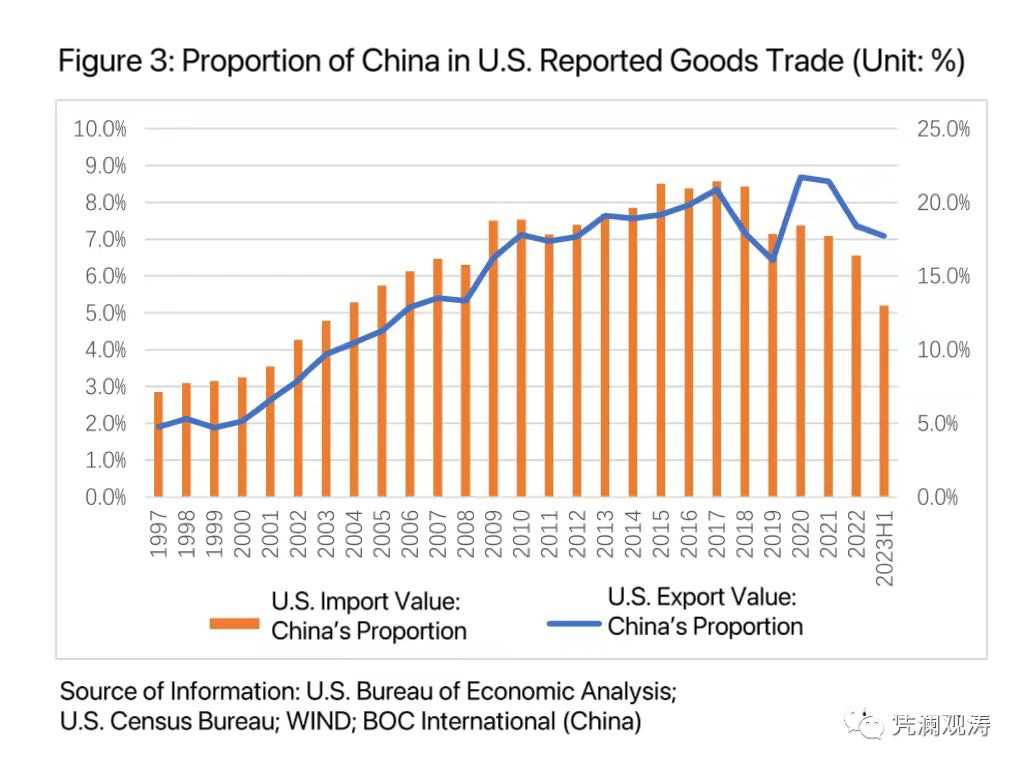
Now, amid “changes of a magnitude not seen in a century”, finding common ground is increasingly difficult. U.S. policy toward China is filled with zero-sum mentalities, from entity lists to the CHIPS Act and investment restrictions, keeping up bilateral and multilateral pressure. As the U.S. builds walls and pushes decoupling, economic and trade ties have cooled. From 2018-2022, China's share of US exports and imports declined 1.0 and 5.0 percentage points, versus 1.3 and 3.5 percentage increases from 1998-2002 (see Figure 3). According to the U.S. government, Chinese investors' share of all foreign holdings of U.S. Treasury securities jumped 5.9 percentage points in 2001-2002, but dropped 7.2 percentage points in 2018-2022. Figures from the Chinese government show that In China's data on overseas securities investment, the U.S. share in China's external portfolio investment assets by country/region fell 8.1 percentage points from 2018-2022.
The domestic environment presents more challenges
Similar exogenous disasters. In 1998, once-in-a-century flooding struck Yangtze River and Songhua River areas, causing direct economic losses of 255.1 billion yuan (35.08 billion U.S. dollars), about 3% of the annual GDP — the highest ever in history. This internal disaster plus external financial crisis meant China missed its "Eight Percent Protection" target [to strive to maintain an 8 percent annual growth rate] set earlier in 1998. Actual growth in 1998 was 7.8%, 3.5 percentage points below the 1993-1997 average.
The once-in-a-century pandemic lasted for three years but the shock persists. the 2020-2022 GDP growth averaged 4.5%, 2.2 percentage points below the 2015-2019 average (see Figure 4). Though COVID controls transitioned steadily in 2023, pandemic scars linger, as manifested in the "wave-like development and zigzag progress".
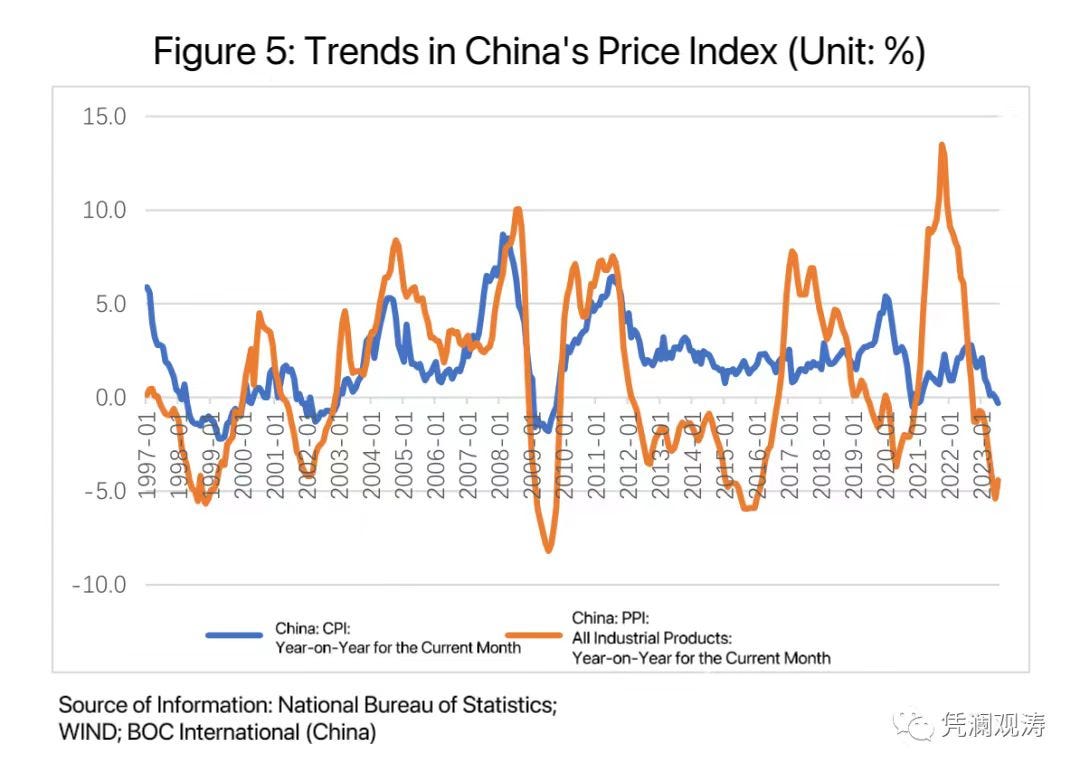
Similar downward price pressure. The Asian Financial Crisis was first time China had experienced a rapid decrease in output under an open economy. By end-1997, the Producer Price Index (PPI) was already negative year-on-year, while the Consumer Price Index (CPI) dropped 6.6 percentage points from 1996 to just 0.4%. In early 1998, policy still leaned towards tightening, fearing that the hard-won control over inflation should give way. State-owned enterprise (SOE) reforms and financial system revamp, etc. also suppressed demand. From 1997-2002, CPI and PPI stayed negative for cumulatively 39 and 51 months, bottoming at -2.2% and -5.7%.
China is not in outright deflation now, but excessively and persistently low inflation is a pending concern. In July 2023, CPI turned negative year-on-year for the first time since February 2021, while PPI has declined year-on-year for 10 consecutive months (see Figure 5). Earlier structural reforms and current cyclical weakness in external demand have combined to make domestic demand recovery slower than expected. The coordinated efforts to crack down on several sectors may have a similar effect as the SOE layoff wave two decades ago (urban SOE employment plunged 19.86 million in 1998, decreasing by an average of 4.74 million from 1999-2002). The government has also realized that China's current economic improvement is mainly recovery, with insufficient internal momentum and inadequate demand.
Domestic demand drivers have shifted. Back then, expanding domestic demand and consumption centered on housing reforms and promoting auto consumption, as well as launching "Golden Week" holidays. In July 1998, Chinese authorities formally unveiled the Notice on Further Reform of Urban Housing System and Speeding up Housing Development to terminate distribution of housing by employers, monetize housing distribution, commercialize supply, and privatize housing. From 1998-2002, the contribution of real estate to GDP growth rose 2.3 percentage points compared to preceding five years. The 10th Five-Year Plan (2001-2005) proposed for the first time vigorously developing auto manufacturing and encouraging private car ownership. Data shows from 1999-2022, China's auto production grew an average 19.4% annually, 14.6 percentage points faster than 1995-1998.
The old toolbox, although still deployed today, has significantly different results in spurring domestic demand and consumption. No new holidays like "Golden Week" have been introduced, but implementing paid leave can still catalyze holiday spending. Auto consumption remains a growth spot, but real estate is languishing. From 2020-2022, the contribution of real estate to GDP growth was 6.3 percentage points lower than the previous five years. Infrastructure investment continues, but with China's economy nearly 25 times larger than in 1998, policy costs have climbed considerably.
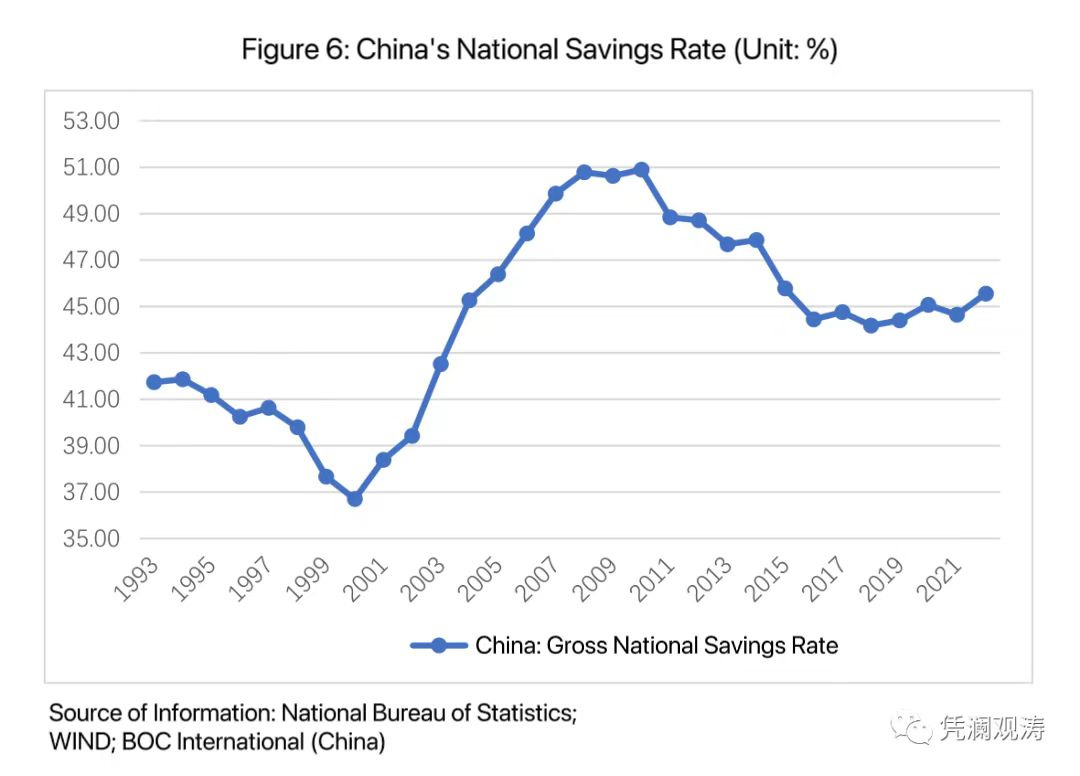
Savings behavior has changed. It used to be more natural for Chinese residents to spend rather than save. SOE reforms and marketization in 1998 energized private enterprises, allowing the private economy to thrive. In 1998, the total number of urban employment rose by 12 percent compared to the 1993-1997 average, but the share of urban SOE employment plunged 15 percentage points to 42% over the same period. With the shifting employment makeup and aspirations for better lives, residents pursued improved living standards. The national savings rate from 1998-2002 averaged 38.4%, down 2.7 percentage points from 1993-1997. It is interesting that although real estate had already taken off, the savings rate still declined.
Now, with private investment hovering low, residents save preemptively. In 2021, the number of urban SOE employment rose 1.3% compared to last year, exceeding non-SOE employment growth for the first time since 1996. In 2022, total employment fell by 8.42 million, down 1.8%. An important factor was that private firms stopped hiring. Given the heightened economic fluctuations and the aftermath of the pandemic in recent years, residents will always seek ways to save money, even as income growth declines. Prepaying loans to secure declining risk-free returns reflects weak confidence and expectations. The national savings rate from 2020-2022 averaged 45.1%, up 0.4 percentage points from 2015-2019 (see Figure 6).
Summary
The current domestic and global landscape is more complex and challenging than over 20 years ago. However, China today boasts stronger overall economic might, richer macro regulation experience, and enormous domestic market potential. The issues encountered are all growing pains along the path of progress. They can be gradually resolved by deepening reforms, expanding opening up, driving innovation, and promoting development. In this regard, the Chinese government does not lack courage or wisdom. Moving forward, while strengthening macro regulation, we should continue to comprehensively deepen reforms, steadfastly implement the strategy to expand domestic demand, vigorously boost consumption, accelerate consumption upgrading, optimize investment structure, expand investment space, support new products and technologies, and cultivate a robust domestic market.
In case you missed it:
More from The East is Read and Pekinology:


