
Wang Xiaolu’s alternative tally of who gets China’s national income
The economist argues that debt, land transfers, and monetary expansion have materially changed income distribution in ways official measures do not capture.


Wang Xiaolu is Deputy Director and Senior Research Fellow at the National Economic Research Institute, and a former standing Council Member of the China Society of Economic Reform under the National Development and Reform Commission (NDRC).
In a recent article, Wang argues that China’s income distribution has shifted sharply in the government’s favour since the 2008 stimulus era. Using a broader gauge of government spending than conventional national accounts allow, he estimates that the state’s effective share of economic resources rose from 19 per cent in 1998 to 41 per cent in 2020, driven by debt-backed investment, hidden local liabilities, and land revenues. That shift, he says, has crowded out household and corporate income, narrowed the space for market allocation, and entrenched a spending model that favours investment and administration over welfare. His remedy is less stimulus, more neutral macro policy, and a fiscal pivot towards social protection and consumption.
The article was published on 25 February on 大势看财经 Dashi Kan Caijing, a macroeconomics-focused channel under Caijing.

王小鲁:国民收入分配,正在发生什么变化?
Wang Xiaolu: What Is Happening to the Distribution of National Income?
Whether the structure of national income distribution is sound has direct impact on people’s well-being and for social equity.
This article examines how the distribution of income among the government, enterprises, and households in China has evolved since the start of reform and opening up, with particular attention to the government’s relationship with the other two sectors. Before turning to that analysis, however, it is first necessary to clarify several theoretical issues involved in accounting for national income distribution.
Some Theoretical Issues in Accounting for National Income Distribution
1.
In national accounting, neither gross primary income and gross disposable income include debt income. Bad debt, if occur, is normally treated as transfer of assets between creditor and debtor, without changing income distribution. This assumption is reasonable in generally. However, in some circumstances, this may not reflect the reallty. For instance, if governments or firms overdraw persistently, they may actually appropriate a part of national income, and, in fact, compressed household and corporate income. History offers many examples of governments running chronic fiscal deficits and relying on continuous borrowing to finance spending shortfalls. Such liabilities were never recorded as government income, yet neither were they ever fully repaid. Much the same can be said of heavily indebted corporations that ultimately collapsed under debt burdens they could not service.
Debt may be written off on paper, but the loss is ultimately shifted, through various channels, onto households and firms. Large volumes of unpayable debt therefore function, in substance, as a form of reverse transfer payment. Where this occurs on a significant scale, the pattern of national income distribution is actually changed.
There are many channels through which debt burden can be shifted to others. Banks, for example, may absorb bad loans by keeping lending rates above normal levels while suppressing deposit rates below them, thereby passing the cost of bad debt onto households and firms. Governments and enterprises may also roll over bad debt by borrowing new funds to service old obligations, concealing the underlying problem and pushing it indefinitely into the future, where repayment may never in fact occur.
Similarly, governments and enterprises may obtain funding through bond issuance or deferred payment. Once these liabilities turn bad, creditors’ claims are effectively wiped out. Some issuers may also be able to rely on their credit standing to issue long-term bonds at below-market interest rates, while the real value of those bonds erodes over time. In all such cases, the debtor in effect appropriates income that does not truly belong to it, while the creditor bears the loss. Disposable income that creditors nominally hold is, in substance, transferred elsewhere and have been spent.
When such practices become widespread, national income accounting that ignores debt transfer can no longer accurately reflect the true state of income distribution.
2.
Excessive money creation by the government is similar to the cases discussed above. Even when it is used to finance fiscal shortfalls, it should not, as a matter of statistical principle, be counted as government disposable income, since money creation does not itself generate new value. Yet it can still reshape the distribution of national income. It may erode the real value of money, generate inflation, thereby shifting costs directly onto consumers. It may also generate bubbles in property or equity markets, leaving homebuyers and shareholders to bear losses when those bubbles burst. In addition, it may fuel a bubble in the real economic sector through overcapacity, the eventual unwinding of which can sharply reduce, or even wipe out, the assets of investors.
The value of such losses is already recorded in the disposable income of consumers, homebuyers, shareholders, investors, creditors, and depositors. But the additional purchasing power created by excessive money issuance is used or absorbed by other sectors, thereby altering the effective distribution of income. These shifts, however, are not captured by the conventional measures of gross primary income or gross disposable income distribution.
3.
In national income accounting, premium income from the sale of land and other assets is not treated as value added and therefore does not enter either gross primary income or gross disposable income accounting. Under normal circumstances, this is appropriate because in most cases, such premiums simply reflect random variations in asset prices arising in the course of transactions. These changes may be positive or negative, and at the aggregate level, they may offset one another. When such a premium arises, the asset itself has undergone no physical transformation. Asset transactions of this kind, therefore, do not create new value.
Because of this accounting principle, the enormous land transfer revenues obtained by governments at all levels in China over many years were not entered national income accounting and were counted as an increase in government disposable income. In 2021, for example, governments at all levels received RMB 8.7 trillion in land transfer revenue. In the same year, local fiscal budget revenue amounted to RMB 11.1 trillion, central fiscal budget revenue to RMB 9.1 trillion, and other “government-managed fund revenue” to RMB 1.1 trillion, bringing total government revenue to RMB 30.1 trillion. Yet according to the National Bureau of Statistics’ national accounts, the total government’s primary income that year was only RMB 12.3 trillion, while total government’s disposable income stood at just RMB 18.5 trillion—roughly 60 per cent and 40 per cent below, respectively, the revenue actually received by the government.
Why is the discrepancy so large? The reason is that China’s land transfer revenue does not represent an ordinary transaction premium. Over the past few decades, China has undergone rapid urbanisation, with the urbanisation rate rising from 17.9 per cent in 1978 to 67.0 per cent in 2024. As the population shifted on a vast scale from the countryside to the cities, land was also reallocated accordingly, with large areas of agricultural land converted into urban construction land.
In economic theory, land, as a factor of production, derives its value from its marginal return, capitalised at the market rate of return on capital. In traditional agriculture, the annual marginal return per mu [0.164 acre] of land is typically only several hundred to one thousand yuan. In urban industry, commerce, and services, by contrast, the marginal return may reach tens of thousands or even hundreds of thousands yuan. It follows that agricultural land and urban construction land can differ in value by handred times. This gap reflects the vast productivity difference between traditional agriculture and modern urban sectors, and the later enhanced by urban agglomeration effect.
Seen in this light, the large-scale conversion of agricultural land into land for modern industries during urbanisation is a process of major resource reallocation and optimisation. It is also part of the process of modernisation. The resulting increase in land prices is therefore not an ordinary transaction premium, but a genuine increase in value. National income accounting theory should accordingly be refined to distinguish between ordinary premiums in market transaction which do not create value, and creation of new value of land arising from optimal reallocation of land resources. Income generated by the latter should be recognised as disposable income accruing to the beneficiary.
The reason national income accounting theory does not distinguish between these two cases is largely historical. By the time the theory and its accounting methods were developed, the major Western economies had already passed through their phase of large-scale urbanisation. What prevailed in their markets was routine land trading, rather than large-scale reallocation of resources amid an economic transformation. This is likely the main reason the latter case was overlooked.
In China, the reallocation of land during urbanisation is taken place under specific institutional constraints. Under the current regulation on land, the conversion of agricultural land into urban construction land should be carried out by local governments only, which expropriate and develop the land, provide compensation to rural collectives, and transfer land-use rights through negotiated transfer, auction and other channels. The proceeds from land auctions can be hundreds of times greater than the cost of land acquisition, making land transfers an immense source of local government revenue. This reallocation of land resources does not occur under competitive market conditions, but within a monopolised market structure. Land prices are therefore monopolised , typically above the equilibrium level that would prevail in a competitive market.
As a result, transaction prices in China’s primary land market in fact contain two components. The first is land value as determined by its equilibrium price. The portion of which above the cost of expropriation—assuming expropriation cost is equal to the shadow price of agricultural land—constitutes value appreciation. The second is monopoly profit arising from monopolistic market power, namely the portion above the competitive equilibrium price. Theoretically speaking, this second component is not value appreciation. But under the principles of national income accounting, monopoly profit should still be counted as part of the seller’s disposable income.
It follows that, during the urbanisation process, land transfer revenue in the primary land market should be regarded as bona fide disposable income of local governments.
In sum, under certain specific conditions, using primary income and disposable income as calculated under the current national accounting framework to study China’s national income distribution may produce serious distortions. The discussion that follows, therefore, relies primarily on a comparison between the government’s actual expenditure and the official data of its primary income and disposable income to examine the actual pattern and its change in national income distribution. The reason for using expenditure as a proxy for income is that expenditure captures not only the spending entity’s disposable income, but also debt-financed income and land revenues, and may therefore offer a more faithful picture of reality.
Trends in Income Distribution Among Government, Enterprises, and Households
In a country where the people are the masters of the country, total output—usually measured by gross domestic product (GDP) or gross national income (GNI) should accrue to the people. Two basic deductions, however, must first be made.
The first deduction is the share that must be allocated to the government to meet the needs of society as a whole. This constitutes government income and may, in functional terms, be divided into three categories. The first consists of expenditure directly devoted to public welfare and social protection, including public education, public healthcare, social security, other forms of household welfare, and transfer payments to low-income and vulnerable groups. The second covers spending arising from citizens’ collective needs, including national defence, public security, foreign affairs, infrastructure, and basic scientific research. The third is the portion required to maintain the operation of government itself, derived from the needs of the first two categories.
The scale and allocation of these three categories of government expenditure should follow several basic principles.
First, spending directly devoted to public welfare and social protection is indispensable, but it must remain consistent with the country’s level of economic development. If it is too low, it will fail to meet people’s needs; if it is too high, it amounts to living beyond current means and imposes a burden on future development. At the same time, such spending should follow the principle of equalisation in basic public services, benefiting all citizens rather than favouring some groups over others, resulting in inequitable distribution.
Second, spending on derived needs such as national defence, public security, and infrastructure must be guided by the criterion of maximising the public interest. Externally, the state should not wage wars that do not serve the people’s interests or use superior strength to bully weaker parties. Internally, it should not invoke public security to suppress the legitimate demands and dissenting views of the people. Public investment in infrastructure and related areas must also align with the principle of social cost-benefit rationality: if too little, it will constrain socio-economic development; if too much, it will generate inefficient investment and waste public resources.
Third, spending required to sustain the government’s own operations should be limited to what is necessary to support the first two categories of need. If insufficient, the government cannot function effectively; if excessive, it becomes a wasteful misuse of public resources. More is not better. Excessive spending of this kind can also foster corruption and entrench vested interests. Government should have no special interests separate from the public interest, still less should it place its own interests above those of the public.
The second deduction is the income that must remain with enterprises, separate from both household and government income, in order to sustain their normal operation and development. Enterprises are the basic units of the economy. Only when they develop soundly can the economy grow, and only then can households’ future incomes be secured.
In a market economy, the distribution of income between enterprises and households is generally formed through market competition within a given legal framework. Households receive income in the form of wages, interest, dividends, rent, bonuses, and other returns, while enterprises retain operating surplus after dividend and bonus payments—that is, undistributed profits—as well as net property income. These income flows are usually determined by market supply and demand and by firms’ operating performance. But government and the central bank also influence them through such tools as minimum wage policies, taxes on different types of income, fiscal subsidies, transfer payments, and interest-rate intervention, to keep the distribution of income between enterprises and households within a reasonable range.
As the above discussion shows, in the distribution of income among the government, enterprises, and households, the government’s relationship with the other two sectors is the decisive variable, while the distributional relationship between enterprises and households is shaped mainly by the market, with the government playing a supplementary regulatory role. The discussion below, therefore, focuses on the government’s role in income distribution and how that role has evolved. To avoid the data distortions discussed in the first section, the analysis measures the share of comprehensive government expenditure in gross national income (GNI), using two indicators.
Comprehensive Government Expenditure I
In China, government expenditure extends beyond budgetary fiscal spending to include outlays through several other accounts, including government-managed funds (including land revenue), social insurance funds, and state capital operations. From 2010 onwards, these components are consolidated in the calculation of comprehensive government expenditure. For earlier years, the calculation is based on a combination of fiscal budget expenditure, expenditure financed by extra-budgetary funds (for which revenue data are used as a proxy in the absence of expenditure data), expenditure financed by land transfer fees (proxied by land transfer revenue), and expenditure from social security funds (from 1989 onwards). (Author’s note: for data after 2010, the portion of fiscal budget expenditure used to supplement social insurance funds has been excluded to avoid double-counting with social security fund expenditure. For data before 2010, state-owned enterprise income has been excluded from extra-budgetary funds revenue, since it does not constitute government income.)
The resulting ratio of comprehensive government expenditure to GNI can be a proxy of the share of economic resources actually allocated by the government (part of which is used for redistribution). It can therefore be compared with the official data of government’s share of gross primary income. The key distinction between the two measures is that the expenditure-based measure includes both debt-financed resources and land transfer revenue. Figure 1 presents this comparison, although data on gross primary income are unavailable before 1992.
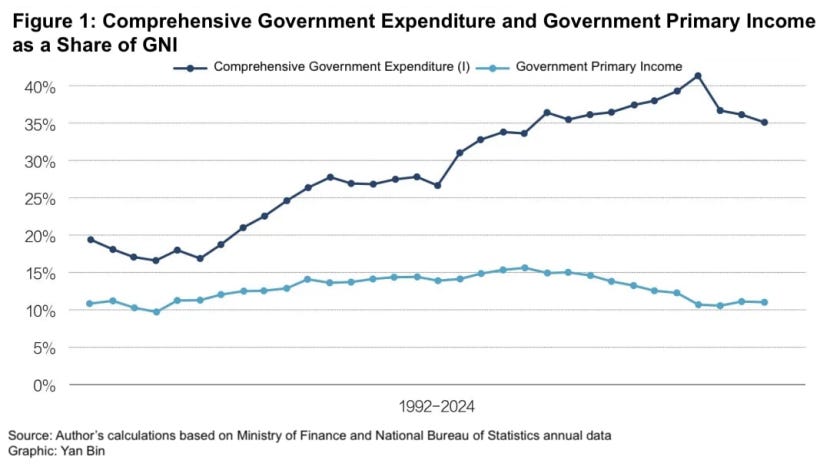
Figure 1 shows that comprehensive government expenditure (I) rose rapidly and persistently from 1998 to 2020, increasing from 19 per cent to 41 per cent of GNI. This points to a steady expansion in the government’s role in resource allocation over this period, meaning that the combined share of enterprises and households fell sharply.
By contrast, the official data of government’s share of total primary income remained stable at 11–16 per cent, meaning the combined share of enterprises and households remained as high as 84–89 per cent. The great difference shaows the failure of it to capture the substantial changes in national income distribution.
Comprehensive Government Expenditure (II)
This measure is derived by excluding social insurance fund expenditure from comprehensive government expenditure (I) and adding back the annual balance of social insurance funds. Social insurance funds are the single largest component of income redistribution. With this deduction, comprehensive government expenditure (II) is used as an approximate comparator for the government’s total disposable income. As before, the key difference is that the former includes government debt-financed income and land transfer revenue.
The comparison reveals essentially the same pattern as Figure 1. Between 1998 and 2020, comprehensive government expenditure (II) rose rapidly from 17 per cent to 35 per cent of GNI, while the government’s total disposable income remained within a range of 14–21 per cent throughout the period. Here too, the income measure fails to capture the marked expansion in the government’s domination over resources. For reasons of space, no separate figure is presented.
To examine more fully how the government’s role in resource allocation has evolved since the start of reform, Figure 2 traces the shares of comprehensive government expenditure (I) and (II) in GNI from 1978 to 2024.
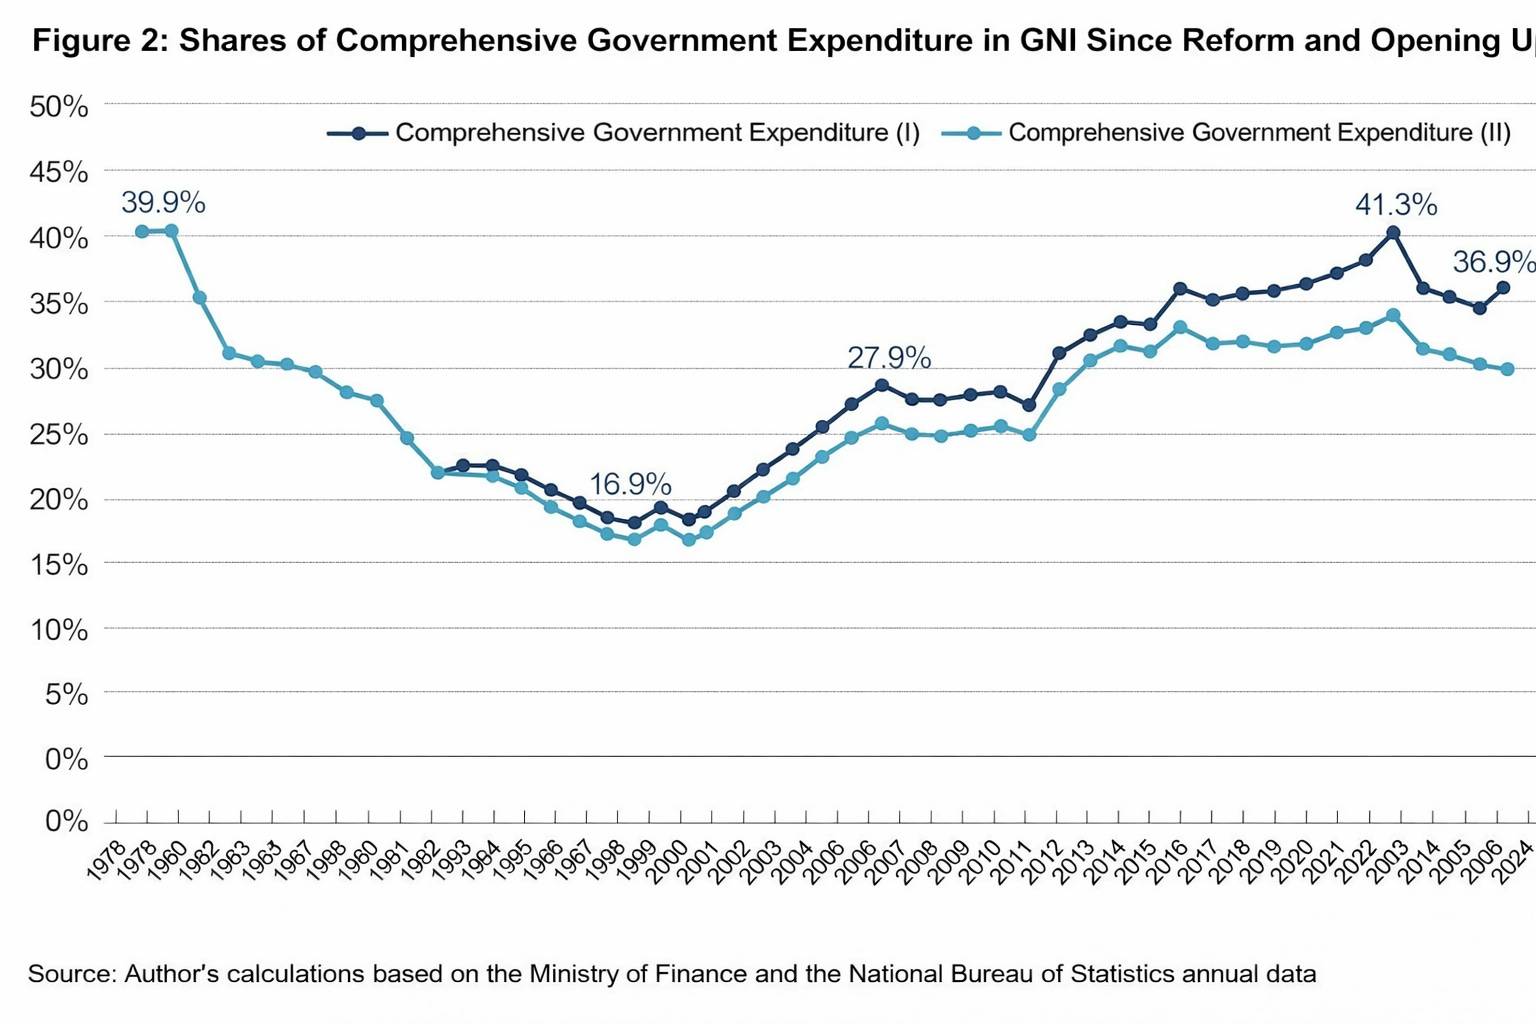
Figure 2 shows that, at the start of the reform era, comprehensive government expenditure accounted for about 40 per cent of GNI. After reform and opening up began, however, this pattern changed dramatically. As the government delegated power and shared benefits to enterprises and households, and as the economy shifted towards a market-based system, the government expenditure share fell sharply from 40 per cent in 1978 to 15–17 per cent in 1995.
It was precisely during this period of gradual government withdrawal from resource allocation that market-oriented township and village enterprises and private firms were able to expand rapidly. By the mid-1990s, the non-state sector was estimated to have accounted for more than half of total output. Household incomes also rose quickly, and living standards improved markedly.
Alongside market-oriented reform, the economy sustained an average annual growth rate of 9.7 per cent over 37 years. Above all, this owed to the rapid rise of the market-oriented private sector from near non-existence to a major economic force. Private firms competed actively, responded quickly to changes in market supply and demand, and operated with stronger incentive mechanism. As a result, they tended to be more efficient and to achieve faster technological progress. This was the most important driver of rapid economic growth.
At the same time, the sharp fall in the government’s share of revenue and expenditure also had some negative consequences, most notably a along with the decline in government revenue, the government capacity to provide public services was weakened. To address these problems and to clarify the respective powers, responsibilities, and revenue assignments of different levels of government, the tax-sharing reform was introduced in the mid-1990s. Following this reform, the share of comprehensive government expenditure rebounded and, after 2003, remained broadly stable for a short period at 27–28 per cent.
That pattern was broken, however, by the large-scale fiscal and monetary stimulus introduced in response to the 2008 global financial crisis. With monetary supply extremely loose, local governments were allowed to establish financing vehicles and borrow heavily for investment, and substantial amounts of local government debt went unpaid. As a result, comprehensive government expenditure began to rise rapidly and continuously. This dual loosening of monetary and fiscal policies did not end with the global financial crisis. Instead, the ratio of government expenditure to GNI continued to increase, exceeding 41 per cent by 2020 and rising above its pre-reform level.
This altered the relatively favourable pattern of national income distribution that had taken shape after reform. Because the principle of market-based resource allocation was not fully realised, government investment came to include large amounts of low-efficiency spending, leading to a decline in overall investment efficiency and total factor productivity. At the same time, an excessively high investment rate crowded out consumption, leaving demand too weak to sustain growth. Prolonged monetary stimulus also drove excessive investment, resulting in widespread overcapacity, mounting pressure on business operations, and falling profitability.
After 2020, the government expenditure share declined modestly. The main reason was the sharp fall in government land revenue following the collapse of the property bubble. Compounded by difficulties of burgetary revenue, government spending was constrained.
The prolonged rise in the government’s expenditure share has, in effect, changed the rules of “dividing the economic pie”, crowding out both enterprise and household income. Yet the Flow of Funds Table of China shows that in 2023, households still accounted for 61.2 per cent of gross disposable income, enterprises for 22.4 per cent, and the government for only 16.4 per cent. Given the scale of government expenditure, these figures clearly fail to capture the true pattern of resource allocation.
In recent years, mounting pressures on business operations, slow household income growth, and a falling consumption rate have all pointed to the adverse effects of changes in income distribution. Household consumption has, for several consecutive years, accounted for less than 40 per cent of GDP, compared with around 50 per cent in the 1980s and 1990s, after the start of reform. This is far below the level seen in most other countries. Excessive government involvement in resource allocation is also an important driver of pervasive corruption, with significant consequences for income distribution.
Alongside the expansion of government expenditure, the structure of government expenditure also has an important impact on national income distribution. Table 1 compares the structure of China’s comprehensive government expenditure (I) in 2020 with that of 35 OECD market economies, excluding a few countries for which data are unavailable.
Table 1 shows that, in 2020, China’s ratio of comprehensive government expenditure to GDP was similar to the OECD average, but the composition of that spending was markedly different. In OECD countries, the shares of social security, public healthcare, and public education in total government expenditure were each far larger than in China. Taken together, these three livelihood-related categories accounted for an average of 66 per cent of government expenditure across the OECD, compared with only 33 per cent in China. This suggests that, in most OECD economies, the bulk of public spending is channelled directly into social welfare or takes the form of transfers that raise household disposable income. In China, by contrast, only around one-third of government expenditure is allocated to the main livelihood-related items. Meanwhile, the shares devoted to administrative expenditure and government investment are much higher than in OECD countries.
It should also be noted that budgeted investment in China represents only a small portion of total government investment, accounting for less than one-fifth of “state-holding investment”. Most government investment is financed through borrowing and land transfer revenue. In 2020, state-controlled investment exceeded RMB 26 trillion, accounting for 59 per cent of total fixed-asset investment in the economy that year.
(Author’s note: The National Bureau of Statistics’ series on “state-holding investment” appears to include both government investment and investment by state-holding enterprises, but provides no explanation and does not distinguish between the two. Since 2018, the Bureau has stopped publishing the absolute level of state-holding investment and now reports only the growth rate. The figures used here are therefore calculated based on those published growth rates.)
This points to a high degree of government command over resources and a major departure from the more market-oriented pattern of resource allocation seen in the early reform period. Taken together, these developments suggest that both the scale and the composition of government expenditure have important consequences for national income distribution.
An important factor behind the expansion of government expenditure has been debt expansion. Debt cannot increase genuine GDP, but it does have a very real impact on the position of households and enterprises in national income distribution. China’s macro leverage ratio—the ratio of combined debt owed by government, non-financial enterprises, and households to GDP—has risen sharply over the past 26 years, climbing from 114 per cent of GDP in 2008 to 300 per cent in 2024, according to data on debt-based aggregate financing to the real economy published by the People’s Bank of China and the macro leverage ratios reported in the China Financial Stability Report.
The macro leverage ratio consists of debt owed by the government, corporate, and household sectors. How much does each account for? Table 2 draws on recent data from the China Financial Stability Report by the Centure Bank, while also offering an estimate of hidden government debt and making some corrections for distortions caused by misclassification.
It is now widely accepted that local governments at all levels carry a substantial amount of hidden debt. Much of this stems from the policy shift in 2008, when both monetary and fiscal policy turned expansionary. Since then, local authorities have set up large numbers of financing vehicles, including so-called “urban investment companies”, to borrow on behalf of governments and fund large-scale investment. Because these entities are usually registered as enterprises, their liabilities are counted in the statistics as corporate debt. In reality, though, they are not genuinely independent firms operating in the market, but financing arms of local governments. Their liabilities are therefore government debt in all but name. This means that the government debt figures reported by the People’s Bank of China in Table 2 are likely to understate the true burden of public debt, while corporate debt is correspondingly overstated.
How large, then, is hidden government debt? Estimates vary enormously. As of 2022, they ranged from RMB 13 trillion to RMB 70 trillion. The lower estimate, however, covers only the bond liabilities of local government financing vehicles and is therefore highly incomplete. The upper estimate, by contrast, may fail to exclude the portion that has in recent years already been converted into explicit government debt. For present purposes, RMB 50 trillion is provisionally adopted as a rough, and relatively conservative, estimate of hidden government debt in 2023 (also see an estimate by Zhang Ming, Deputy Director of the Institute of Finance and Banking at the Chinese Academy of Social Sciences), and the 2023 sectoral debt figures in Table 2 are revised accordingly.
On this basis, actual government liabilities in 2023 may need to be revised upwards from RMB 71 trillion to RMB 121 trillion, with the government leverage ratio (government debt to GDP) correspondingly rising from 56 per cent to 96 per cent. Corporate debt, by contrast, may need to be revised downwards from RMB 212 trillion to RMB 162 trillion, reducing the corporate leverage ratio from 168 per cent to 128 per cent. The household leverage ratio remains unchanged at around 72 per cent. The final row of Table 2 reports these revised estimates.
On a rough calculation, over the 14 years from 2008 to 2023, the revised government leverage ratio rose sharply from below 30 per cent to 96 per cent, an increase of more than 66 percentage points. This suggests that the expansion of government debt was the principal force pushing up the macro leverage ratio over the period. Hidden government debt is the riskiest component of that process.
After revision, the corporate leverage ratio in 2023 stands at 128 per cent. It is estimated to have risen by around 60 percentage points since 2008, making it the second-largest contributor, after government leverage, to the overall increase. The main driver was the excessive build-up of liabilities in the real estate sector. Over the same period, the household leverage ratio is estimated to have risen by around 50 percentage points, which is likewise substantial. Here too, the main driver was the expansion of housing-related debt, especially mortgage borrowing, again reflecting the overexpansion of the property sector. That overexpansion, in turn, was itself the product of unrestrained borrowing and prolonged monetary stimulus.
Ways to improve the national income distribution
It is clear that, since 2008, China’s pattern of national income distribution has evolved in several undesirable ways. These developments are closely linked to the crowding-out effects of large-scale government debt-financed investment and prolonged monetary easing on corporate and household income, as well as the resulting narrowing of the market’s role in resource allocation. They are also closely related to the structure of government expenditure, in which transfers to households have remained relatively limited, while direct government investment and administrative spending have been comparatively high.
To change this pattern, the basic objective of macroeconomic policy should shift away from short-term growth stimulus and towards safeguarding the long-term health of the economy and society, promoting a more balanced distribution of national income, and maximising long-term public welfare. This requires monetary policy to return to a neutral stance, and fiscal policy to move away from its heavy reliance on expanding government investment and towards improving livelihoods and supporting consumption, while reducing non-essential and inefficient investment and administrative expenditure.
The structure of government expenditure also needs to be reoriented, with greater emphasis placed on strengthening public services and social protection, improving household and corporate income and welfare, and ensuring that all citizens share in the gains from development, while leaving the primary role in resource allocation to the market. This requires further government reform and a transition from an all-encompassing, GDP-centred state to a more service-oriented one. Consideration should also be given to using a sufficient volume of state-owned assets, whether through market transfer or direct allocation, to strengthen the social security fund, reduce the contribution burden on firms, and promote universal social security coverage. Finally, the existing household registration system, which continues to divide urban and rural residents, should be reformed as soon as possible so that equal treatment as citizens can be realised at an early date.
Yu Yongding: There Is No “Consumption-Driven” Growth Model, and China’s Infrastructure Investment Is Far From Saturated

For a growing number of economists, both outside China and increasingly within it, the central question facing the world’s second-largest economy is its exceptionally weak domestic demand. Beijing, at least rhetorically, has moved in the same direction. Over the past two years, “
Xu Gao: Why curbing investment can backfire in China

Xu Gao, the Chief Economist and Assistant President of Bank of China International Co. Ltd., and an adjunct professor of the National School of Development (NSD) at Peking University, has been featured on The East is Read several times.
Li Xunlei: Why China’s debt keeps climbing while others’ have eased

Li Xunlei, Chief Economist at Zhongtai Financial International Limited. Li has worked extensively at other Chinese securities banks, including Junan Securities, Guotai Junan Securities, and Haitong Securities. He is one of the most renowned chief economists among major domestic securities firms in China.
Xu Xianchun explains GDP calculation in China

In a report last Friday, Bloomberg quoted Gao Shanwen [see his feature on The East is Read], Chief Economist at SDIC Securities Co., Ltd., who suggested that China's economy likely grows slower than official figures suggest:
Senior statistician explains China's GDP accounting

There is no shortage of suspicions and questions directed toward China’s official statistics and the government organ behind it - the National Bureau of Statistics. Recently, Xu Xianchun, currently a Research Fellow at the National School of Development at Peking University and formerly a senior statistician published the book
China’s consumption problem is an income distribution problem

Last month, Cai Fang, former Vice President—meaning Vice Minister—of the Chinese Academy of Social Sciences (CASS), wrote in the Communist Party of China (CPC)’s flagship journal Qiushi that China should optimise its income distribution structure through institutional development.
 | A guest post by
|