
Wang Xiaolu: Why More Stimulus Has Meant Weaker Demand in China
Economist argues years of loose money and state investment have weakened consumption and deepened overcapacity, and calls for a more neutral monetary policy and livelihood-centred fiscal spending.


Wang Xiaolu is Deputy Director and Senior Research Fellow at the National Economic Research Institute and a former standing Council Member of the China Society of Economic Reform under the National Development and Reform Commission (NDRC).
Wang Xiaolu received his PhD in Economics from the Australian National University in 1998. He received the first and the eleventh Sun Yefang Award for Economic Science Papers (1984 and 2004), the highest honour in Chinese economics and the first China Soft Science Award (2010). In 2010, he was recognised by China Financial Weekly as one of the economists who had exerted an important influence on China’s economy, and was selected by Southern People Weekly as one of the hundred Chinese public intellectuals. His research on “grey income”—income missing from official statistics—was ranked by People’s Tribune as the leading item among the Top Ten Social Viewpoints of 2010.

In this article, Wang challenges a widely accepted policy assumption in Beijing—that investment demand can reliably compensate for insufficient consumer demand. He argues that this logic, influential in Chinese macroeconomic thinking for many years, has been applied far beyond the temporary and limited circumstances in which it might be justified. In the Chinese context, he suggests, the prolonged use of such measures has helped entrench an economy that is overly dependent on government-led and state-directed investment, while leaving household consumption unusually low by international standards.
On that basis, Wang calls not for another round of familiar stimulus, but for a shift in the macroeconomic framework itself. Monetary policy, he argues, should return to a more neutral stance, while fiscal policy should move away from investment-heavy expansion and towards livelihoods, public services, and social security.
This article is drawn from Liu Shijin (ed.) (2026), Looking Ahead to the 15th Five-Year Plan: International Experience and China’s Strategy for Crossing into a High-Income Society, 前瞻十五五:跨进高收入社会的国际经验与中国战略, CITIC Press. Liu Shijin is a Former Vice President (Vice Minister) of the Development Research Centre (DRC), a comprehensive policy research and consulting institution directly under the State Council.
With the author Wang Xiaolu’s consent, this translation is based on a Chinese text provided by him and includes only Parts I, II, and IV of the original article. This text may differ slightly from the version published in the book. Both Wang Xiaolu and Liu Shijin authorised the translation.

提振消费需求的关键
The Key to Boosting Consumer Demand
I. Why Does More Stimulus Produce Even Weaker Demand?
A widely held view maintains that if aggregate demand is insufficient, the economy should be stimulated through loose monetary policy and an expansionary fiscal policy centred on increased government investment. Data shows that over the past decade and more, the intensity of China’s monetary stimulus has never weakened.
Figure 1 compares the growth of M2 and nominal GDP since 1990. The gap widened markedly over time, especially after 2008. By 2024, nominal GDP was under RMB 135 trillion, while M2 had risen above RMB 313 trillion, leaving M2 at more than 2.3 times the size of GDP.
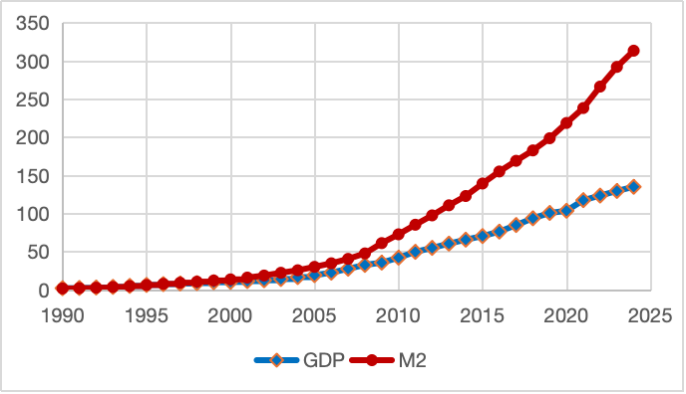
Between 2008 and 2024, nominal GDP grew at an average annual rate of 9.8 per cent and real GDP at an average annual rate of 7.0 per cent, whereas M2 grew at an average annual rate of 12.8 per cent, 5.8 percentage points higher each year than the real GDP growth rate.
In particular, during the effort to counter the international financial crisis, M2 surged by as much as 28.5 per cent in 2009 and continued to rise by 19.7 per cent in 2010. The so-called “moderately loose” monetary policy was in fact extremely loose. From 2007 to 2012, M2 expanded from RMB 40 trillion to RMB 97 trillion, an increase of 141 per cent in just five years.
After the global financial crisis, monetary easing was never fully unwound. From 2012 to 2016, M2 grew by 11.3 to 13.8 per cent a year, roughly 5 to 6 percentage points faster than real GDP. M2 growth moderated to 8 to 9 per cent between 2017 and 2019, but still outpaced GDP by about 2 percentage points. In 2020, M2 growth returned to double digits. Official data show that from 2020 to 2024, real GDP expanded by an average of 4.7 per cent a year, while M2 grew by 9.6 per cent on average, maintaining a gap of about 5 percentage points.
On the fiscal front, the State Council launched an RMB 4 trillion investment programme in November 2008, scheduled for completion by the end of 2010. However, National Bureau of Statistics data show that total fixed-asset investment rose by RMB 3.7 trillion in 2009 and RMB 7.4 trillion in 2010 relative to 2008, equivalent to year-on-year growth of 26 per cent and 20 per cent. State-holding investment accounted for much of the increase, rising by RMB 2.2 trillion and RMB 6.1 trillion respectively over 2008, with growth rates of 35 per cent and 18 per cent. Its cumulative increase alone far exceeded the headline RMB 4 trillion package, making it the main driver of the investment boom.
Nor did this momentum end with the crisis. From 2008 to 2016, state-controlled annual fixed-asset investment expanded from RMB 6.4 trillion to RMB 21.4 trillion, reaching 3.3 times its 2008 level. The true increase was larger still, since the statistical methodology changed during this period and, from 2011 onward, investments below RMB 5 million were no longer included.1
The key to this surge in government investment was the decision to allow local governments to set up local government financing vehicles (LGFVs) to borrow for investment. That opened the door to a wave of debt-driven spending by local authorities with little regard for consequences. Ultra-loose monetary policy further enabled this borrowing binge and amplified the investment boom. Central bank data published in 2011 show that by the end of 2010, more than 10,000 LGFVs had been established nationwide, with outstanding loans of RMB 14.37 trillion. That was equal to 3.4 times total local fiscal revenue in 2010, which stood at RMB 4.24 trillion.
In the years that followed, even after the global financial crisis had passed, the push for government-led investment was not reversed, and lending to LGFVs continued to grow. The central bank does not appear to have released comparable figures later on, but industry estimates suggest that cumulative debt-financed investment by LGFVs during this period exceeded RMB 20 trillion, several times already the size of the original RMB 4 trillion stimulus plan.
According to the National Bureau of Statistics, nominal fixed-asset investment across the economy grew by an average of 10.2 per cent a year between 2008 and 2024, 0.4 percentage points faster than nominal GDP. Over the same period, state-holding investment—that is, government investment plus investment by state-holding enterprises—rose by an average of 11.6 per cent a year, nearly 2 percentage points above nominal GDP growth. The pattern of government and state-sector investment consistently outpacing economy-wide fixed-asset investment has persisted to this day.
In 2008, state-holding investment accounted for 44.3 per cent of total fixed asset investment across the whole economy; by 2024, that share had reached 55.1 per cent. Over the same period, state-holding investment as a share of GDP rose from 19.7 per cent to 25.1 per cent.2
The above makes clear that over the past decade and more, highly stimulative loose monetary policy and proactive fiscal policy centred on expanding government investment have never truly abated.
Yet despite persistently loose and proactive monetary and fiscal policy, insufficient demand and corporate overcapacity have remained central constraints on growth. Economic expansion has continued to slow from the high rates of the past. Most strikingly, the consumption rate, meaning final consumption as a share of GDP, accounted for just 56 per cent of GDP in 2024, 21 percentage points below the world average. Household consumption was below 40 per cent of GDP, an unusually low level by international standards. Insufficient consumer demand is now a principal source of economic weakness.
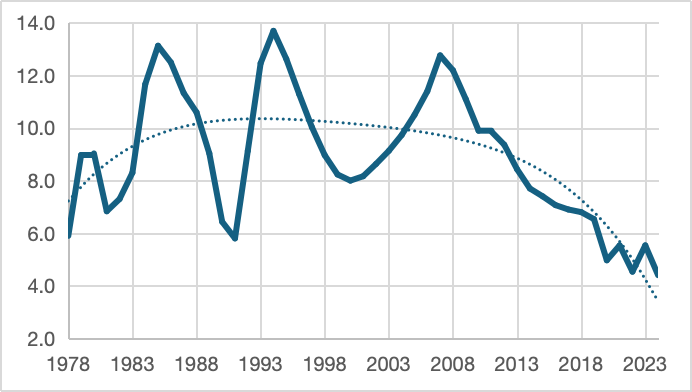
Figure 2 plots GDP growth from the start of reform and opening up in 1978 through 2024, using National Bureau of Statistics data. To smooth short-term volatility and clarify the longer-term trend, the series is presented as a three-year moving average. As the chart shows, China’s growth rate rose quickly from below 6 per cent in 1978 to around 10 per cent in the early 1980s, and then remained at roughly that pace for more than three decades.
But the post-2008 period of large-scale monetary and fiscal loosening marked a turning point. Growth remained above 9 per cent only briefly, from 2009 to 2011, before entering a prolonged slowdown. After 2015, China definitively moved off its previous high-growth path of above 7 per cent. Since then, growth has continued to trend down, albeit with fluctuations. More than a decade on, there is still no clear sign that this downward trajectory is ending.
Throughout this period of slowing growth, both monetary and fiscal policy remained loose. As the earlier data show, money supply and government investment continued to grow persistently and significantly faster than the economy itself, indicating that monetary stimulus and investment-led fiscal expansion were never meaningfully withdrawn. Yet sustained monetary and fiscal easing did not reverse the underlying pattern of weak demand and slower growth.
These circumstances suggest a strong case for fundamentally rethinking the macroeconomic framework that has guided policy for so long. The problem is not simply a shortfall in aggregate demand, but a deeper imbalance in its composition: investment has been excessive, while consumer demand has remained severely weak. That imbalance is closely tied to years of expansionary monetary policy and a government-investment-led expansionary fiscal strategy.
II. The Theoretical Defects of Keynesianism and the Chinese Experience
One obvious defect in Keynesian theory is its assumption that consumer demand and investment demand are in a fully substitutable relationship. According to this theory, if saving is too high and household consumption too weak, policymakers can offset the gap by loosening monetary policy to spur investment, or by having the state invest directly. The expansion of investment demand is thus expected to compensate for weak consumption, restore equilibrium between aggregate demand and aggregate supply, and put the economy back on a growth path. This logic implies that even wasteful public works—endlessly digging holes only to fill them in again—can generate growth, so long as money is spent.
In reality, however, any such effect is at best short-lived. Policies that boost investment may raise demand in the near term, but over the medium to long run, they further expand production capacity and increase supply, thereby worsening the structural imbalance between excess supply and weak demand.
To take one example, when the monetary authorities inject liquidity, encourage banks to issue loans for firms to build new factories, add equipment, and enlarge production capacity, demand does rise during the construction phase, particularly for investment goods such as steel, cement, and machinery. But once the projects are completed, that demand drops away abruptly, while new productive capacity appears. What has been added is supply. And final demand, which is already weak, becomes even less able to absorb the additional output.
At the level of the overall economic structure, only sufficiently strong consumer demand can ultimately absorb this intermediate capacity. If consumption remains weak while upstream and midstream capacity continue to expand, overcapacity becomes unavoidable. The imbalance between supply and demand then intensifies, inventories accumulate, products go unsold, and growth weakens further.
Government investment, of course, can be directed mainly toward infrastructure rather than productive capacity. When such spending creates genuinely useful infrastructure and relieves bottlenecks in transport, communications, and related areas, it can generate positive spillovers, support growth, and raise returns across the wider economy. But when infrastructure investment becomes excessive or duplicative, it too turns into low-yield or ineffective spending, consuming resources without generating commensurate returns and becoming little different from overcapacity. If continued, it will inevitably depress economy-wide returns, steadily erode the efficiency of resource allocation, and leave growth weaker. At the same time, high investment spends national income that might otherwise have gone to households, further suppressing consumer demand and deepening its inability to drive growth.
Therefore, the assumption that investment demand can fully substitute for consumer demand is a serious theoretical error. The two must remain in reasonable structural balance. Modern economics has long recognised this through the “golden rule of capital accumulation” and the “Golden Rule savings rate”: under given conditions, there is an optimal rate of accumulation and investment that maximises household consumption and overall social welfare. If the investment rate rises above or falls below that range, long-run economic performance suffers.3
Macroeconomic policy should prioritise maintaining long-term, balanced, and sustainable development, particularly by preserving a balanced investment- consumption pattern. If policymakers rely repeatedly on stimulus to boost investment and generate short-term growth, while sacrificing the long-term optimisation of household consumption and coordinated economic development, the result will be to damage both public welfare and overall economic performance. In the end, the costs will outweigh the gains.
For a long time, Keynesian demand-management theory has had a strong influence on economic research and macroeconomic policy in China. One distortion has been that short-run policy measures for particular circumstances have been treated as instruments for long-term use. This is, in fact, what has led to the persistent structural imbalance in demand, producing the paradox that the more stimulus applied, the more acute the insufficient demand has become.
It should be noted that Keynesian policies do not necessarily produce a structural imbalance of excessive investment and weak consumer demand. In most advanced Western economies, monetary and fiscal expansion is used with restraint, and short-term stimulus is generally withdrawn in a timely manner. Fiscal expansion, moreover, is usually not centred on government investment. More often, it takes the form of transfers to households to improve livelihoods. That tends to raise, rather than depress, consumption. These economies also have a very different structure: consumption rates are much higher than in China, while investment rates are much lower. As a result, even if short-term stimulus causes the investment rate to rise, it generally does not lead to serious overcapacity.
Figure 3 traces changes in China’s demand structure, focusing on the final consumption rate (final consumption share of GDP) and the capital formation rate/investment rate (capital formation share of GDP). Net exports are omitted because they account for only a small portion. From the start of reform in 1978 to 2002, the final consumption rate fluctuated modestly around an average of 63 per cent, while the investment rate hovered around 36 per cent. After 2002, however, the pattern shifted markedly: the investment rate kept rising as the consumption rate kept falling. This divergence became even more pronounced after 2008. By 2010, the consumption rate had dropped below 50 per cent, while the investment rate had climbed to nearly 50 per cent, marking the point of greatest imbalance between the two.
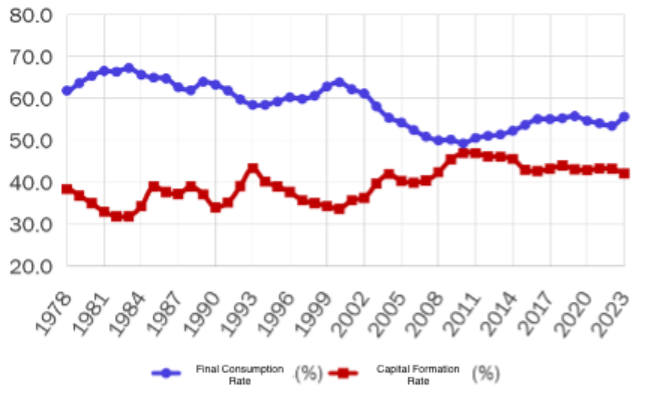
After 2010, the investment rate edged down, mainly as a result of spontaneous market adjustment—that is, reduced investment by private enterprises—while the consumption rate recovered slightly. Even so, the investment rate has remained above 42 per cent, well above the 36 per cent average recorded during the first two decades after reform. The consumption rate has recovered modestly, to around 55 to 56 per cent, still far below its earlier average of 63 per cent. Most strikingly, household consumption has accounted for just 37 to 39 per cent of GDP in recent years, an exceptionally low level by international standards.
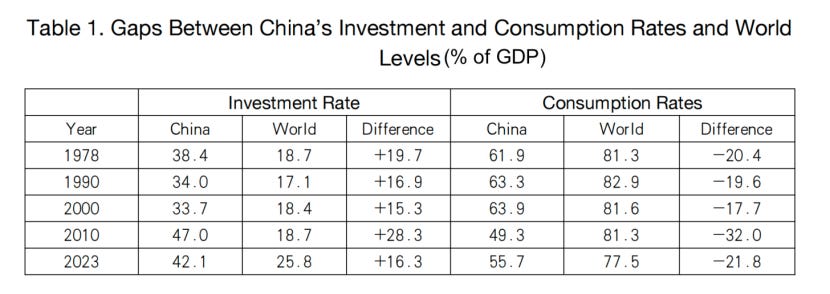
Table 1 compares China’s investment and consumption rates both over time and against global levels. Longitudinally, China’s investment rate was 38.4 per cent in 1978, falling to 34.0 per cent in 1990 and 33.7 per cent in 2000 during the reform period. Over the same period, the consumption rate rose from 61.9 per cent in 1978 to 63.3 per cent in 1990 and 63.9 per cent in 2000. By 2010, however, the pattern had reversed sharply: the investment rate had climbed 15.3 percentage points to 47.0 per cent, while the consumption rate had fallen 14.6 percentage points to 49.3 per cent. By 2023, the latter had recovered only partially, to 55.7 per cent.
Against global benchmarks, China’s investment rate was about 20 percentage points above the world average, while its consumption rate was about 20 points below it in 1978. By 1990 and 2000, the investment rate was about 17 and 15 percentage points above the global level, and the consumption rate about 19 and 18 percentage points below it, respectively. Thereafter, the trend reversed. By 2010, China’s investment rate stood 28 percentage points above the world average, while its consumption rate was 32 percentage points below it. By 2023, the gap remained: China’s investment rate was still 16 percentage points above the global level, and its consumption rate 22 percentage points below it.4
From the launch of reform in 1978 to 2000, China maintained an average investment rate of around 36 per cent and an average consumption rate of around 63 per cent. Although the investment rate was already well above the world average and the consumption rate well below it, the pattern broadly reflected the conditions of that time. Reform and opening up had placed China on a path of rapid growth, industrialisation, and urbanisation, all of which generated exceptionally strong investment demand. In that context, an investment rate significantly above the global norm and a consumption rate significantly below it were generally consistent with the economy’s stage of development.
But as industrialisation and urbanisation have moved ever closer to completion, industry’s share of GDP has fallen, the tertiary sector’s share has expanded, and China has gradually moved toward a more post-industrial economy. Meanwhile, urban residents have become a major part of the total population. Demand for urban construction and infrastructure has also moved progressively closer to saturation, even as equal access to public services and social security for migrants to the cities has yet to be fundamentally resolved.
Under these conditions, the investment rate should gradually decline, and the consumption rate should rise, particularly as fuller social protection and more equal public services become necessary to match the economy’s changing structure. Yet over the past two decades, the investment rate rose sharply and, in recent years, has retreated only modestly from its peak. That is closely linked to monetary easing and the continued expansion of government-led investment.
An excessively high investment rate has led to serious overcapacity. Beginning in 2015, China implemented the policy of “cutting overcapacity, reducing excess inventory, deleveraging, lowering costs, and strengthening areas of weakness”, and carried out large-scale capacity cuts in sectors suffering from severe oversupply. Capacity in industries such as steel, coal, and cement contracted sharply for a time. Yet by 2023, according to the National Development and Reform Commission (NDRC), overall industrial capacity utilisation still stood at only 75 per cent, unchanged from the level reported when China first moved to tackle severe overcapacity in 2013–2015. Firms continue to face broad-based difficulty in selling their output. That suggests that serious overcapacity remains widespread across the economy.
The reason is that earlier efforts relied mainly on administrative measures to cut capacity in a few sectors, while leaving the underlying drivers of overcapacity largely intact—excessive investment, excessive monetary expansion, and excessive government borrowing. To address the structural imbalance at its root, those deeper institutional and systemic causes must be changed first.
It should also be noted that China’s official capacity utilisation figures differ markedly from those reported in other research. In a 2012 report, for example, researchers of the International Monetary Fund estimated that China’s industrial capacity utilisation rate had fallen to around 60 per cent. Several studies by Chinese research institutions reached similar conclusions. On those estimates, actual utilisation at the time was well below 75 per cent, suggesting that the official figures may have overstated the level of capacity use. That discrepancy may well persist today.
Overcapacity leaves firms struggling to sell their output, intensifies competition, fuels destructive price wars, raises the share of loss-making enterprises, and depresses overall efficiency. It is thus an important drag on economic growth. In recent years, the producer price index (PPI) has continued to fall, a pattern commonly described as deflation. Some take this to mean that money is too tight and that the answer is another round of monetary expansion. That reading is incorrect, both in theory and in practice.5
Under normal conditions, monetarist theory would predict that excessive money creation pushes prices higher and generates inflation. In China’s current circumstances, however, prices have continued to weaken. The explanation is straightforward: overcapacity and unsold output have forced firms into repeated price cuts and aggressive price competition simply to stay afloat, pulling prices down rather than pushing them up. And the root cause of that overcapacity is precisely the prolonged monetary easing that has encouraged excessive investment.
The property sector, however, followed a markedly different pattern from industry. Because land is finite and non-reproducible, and because its supply is monopolised by local governments, property did not for many years face the same kind of price-cutting competition seen in manufacturing. Under those conditions, continued monetary expansion translated instead into sharply rising asset prices. In the two decades to 2021, the average selling price of newly built commercial housing nationwide increased fivefold. In major cities, housing prices rose by 10 to 20 times, and in the most extreme cases by 30 to 40 times, notably in the central districts of megacities such as Beijing and Shanghai.
Stimulated by the surge in housing prices, the scale of property construction expanded ever further, and the problem of excessive investment became even more pronounced (see Table 2).
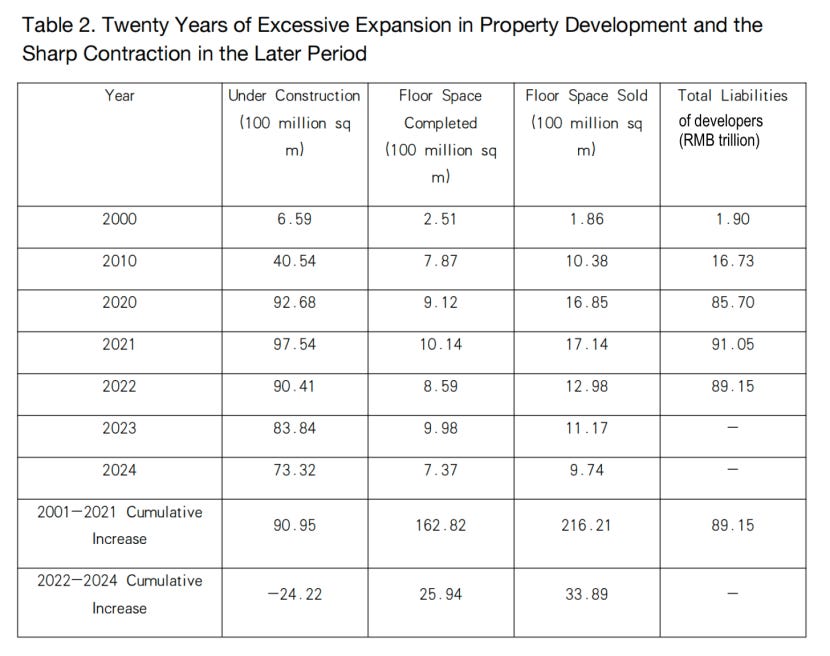
Note: 2022 marked a turning point for the property sector, so the cumulative increase reported in the table is split into two periods, 2001–2021 and 2022–2024. Floor space under construction and total liabilities are stock variables, so their cumulative increase is measured as the value in the final year minus the value in the year immediately preceding the period. Floor space completed and floor space sold are flow variables, so their cumulative increase is measured as the sum of annual values over the period. A dash indicates that no data are available.
As Table 2 shows, floor space under construction for housing nationwide rose from just over 600 million square metres in 2000 to more than 4 billion in 2010, and continued to expand rapidly even during the period of “property destocking”, surpassing 9.7 billion square metres by 2021. By contrast, annual completed floor space remained broadly below 1 billion square metres. In effect, this amounted to a large-scale build-up of disguised inventory.
The reasons are, on the one hand, persistently rising land and housing prices encouraged developers to acquire and hold as much land as possible, and to delay the sale of completed units in order to capture further capital gains. On the other hand, policy restrictions on hoarding land and housing pushed developers toward a different strategy: expanding construction. Once land had entered construction, it no longer counted as land hoarding, so a larger land area under construction, combined with slower housing completion and sales, became a lawful way to hoard land and housing.
Yet excessive investment and an outsized expansion of housing construction ultimately produced a severe oversupply. Once economic conditions weakened and speculative demand withdrew on a large scale, these contradictions surfaced all at once. From 2022 onward, the property market entered a prolonged downturn, with house prices shifting from sustained increases to decline, and both floor space under construction and floor space sold falling sharply. Yet the run-up in property prices over the two decades before the bubble burst was entirely consistent with the monetarist view of the link between money creation and inflation. In China, excessive monetary expansion did generate inflation, but for the reasons discussed above, it showed up not in manufactured goods, but primarily in the property sector.
Because the problems of excessive money supply and excessive investment were never resolved, past efforts at deleveraging also failed to achieve their intended effect. China’s macro leverage ratio—the combined debt of government, non-financial corporates, and households as a share of GDP—rose from 114 per cent in 2008 to 194 per cent in 2015, and reached 300 per cent by 2024.6 The forces behind this steady rise in leverage are the same ones that produced industrial overcapacity and the property boom: persistently loose monetary conditions and the continued expansion of debt-financed investment.
…
IV. A Recovery in Consumption Depends on Macroeconomic Policy Adjustment and a Restructuring of Government Spending
China’s weak consumer demand is closely tied to fiscal policy and the composition of government expenditure. Table 6 offers a simple cross-country comparison of spending structures. In 2020, China’s broad measure of government expenditure—combining budgetary fiscal spending, government-managed fund spending, social security fund spending, and state capital operating expenditure—reached 41 per cent of GDP.
The comparison in the table covers 12 OECD countries whose economies rank among the world’s 20 largest: Australia, Canada, France, Germany, Italy, Japan, the Netherlands, South Korea, Spain, Switzerland, the U.K., and the U.S. On the surface, then, China’s government spending, measured as a share of GDP, appears broadly comparable to that of OECD countries. In reality, however, the structure of that spending differs markedly.
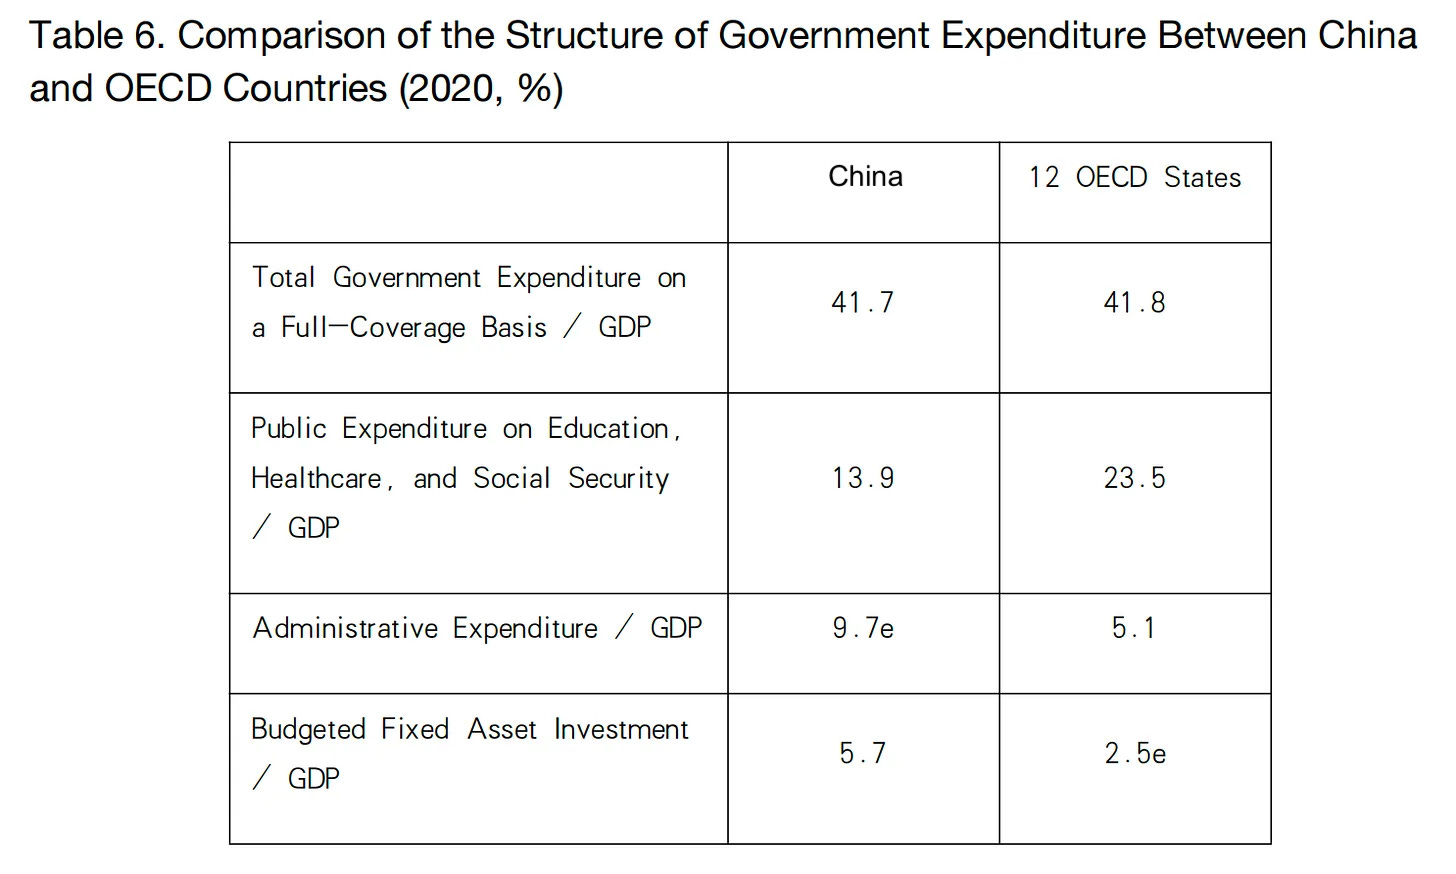
First, spending on public services—education, healthcare, and social security—amounts to just 13.9 per cent of GDP in China. Across the 12 OECD countries in Table 6, the average is 23.5 per cent, nearly 10 percentage points higher.
Second, China’s administrative expenditure stands at 9.7 per cent of GDP. Because of data limitations, this excludes the portion of government-managed fund spending used for administrative purposes, so the true figure is likely higher still. The average for the 12 OECD countries is 5.1 per cent of GDP, roughly half of China’s level.
Third, budgeted fixed-asset investment amounts to 5.7 per cent of GDP in China, compared with an estimated average of 2.5 per cent in the 12 OECD countries. But even this understates the scale of government-led investment in China. Budgeted investment accounts for only a small share of total government investment in China, much of which takes place outside the budget and therefore does not appear in Table 6. As noted earlier, state-holding investment in 2024 was equivalent to 25.1 per cent of GDP, several times the size of budgeted government investment.
Measured against broad-based total government expenditure, spending on public education, public healthcare, and social security accounts for 56 per cent of government outlays in the major OECD economies, meaning that more than half of public revenue is used directly to support households’ welfare. In China, by contrast, although spending on these three livelihood items has risen over time, it still accounts for only 33 per cent of broad-based total government expenditure, 23 percentage points lower than in the major OECD countries. Much of the remainder is directed instead toward two areas: 1) government investment, 2) administrative and institutional spending. Outlays in these categories are twice as high as in advanced market economies, while livelihood spending is markedly lower.
In practice, much of government investment takes place outside the fiscal budget, through channels such as government-managed funds and debt raised by governments at different levels via financing platforms. The scale of this off-budget investment far exceeds the budgeted government investment. Some of it is, of course, reasonable and necessary: effective infrastructure, when well targeted, can support economic development. But both government investment and administrative spending also contain waste, undermining efficient resource allocation and limiting improvements in public welfare.
In addition, China’s household saving rate, that is, household savings as a share of household disposable income, is too high, standing at 23 per cent in 2023, and this is also an important cause for insufficient consumer demand. The main reason for the high household saving rate is that income redistribution, social security, and the public service system do not provide comprehensive coverage and have failed to furnish households with adequate protection and services, forcing many households to reduce consumption and increase savings to cope with future risks relating to illness, old age, unemployment, children’s education, and similar concerns.
Therefore, to resolve weak consumer demand and restore healthy, sustainable economic growth, China’s macroeconomic framework needs to change. Monetary policy should return to a more neutral stance, while fiscal policy should shift away from focusing on government-led investment to improving livelihoods. Without such a shift, it will be difficult to correct the structural imbalance in demand.
To advance this transformation, it is desired that the consumption rate rise by at least 10 percentage points, returning to the 65 to 70 per cent range, while the investment rate should fall by around 10 percentage points, to the 30 to 35 per cent range, with further adjustment according to changes in the economic structure.
The data are drawn from the National Bureau of Statistics’ revised historical fixed asset investment statistics published in China Statistical Yearbook 2021. This revision reduced the overstated investment figures reported in previous years and seems more accurate. Subsequent further revisions to the historical data are not adopted.
Since 2018, the National Bureau of Statistics has stopped publishing the absolute value of state-holding investment and now releases only its growth rate. The share here is an estimate derived from those published growth rates.
E. S. Phelps (1961), “The Golden Rule of Accumulation: A Fable for Growthmen”, American Economic Review, 51(4), 638–643. It should be noted that a sustained policy of expanding government investment, while raising the economy’s investment rate, will raise the overall saving rate as well. The reason is that when the state channels more resources into investment, it also diverts resources away from household consumption and livelihood spending, rather than simply mobilising idle private savings for productive use, as Keynesian theory assumes. In other words, investment demand is not merely supplementing consumer demand; it, to some level, is substituting for it and crowding it out.
The investment rate and consumption rate data cited here are drawn from the National Bureau of Statistics, China Statistical Yearbook 2024. However, the National Bureau of Statistics has repeatedly revised the historical data for both the investment rate and the consumption rate. For example, the investment rate for 2010 was initially published as 48.6 per cent, and was later revised down several times to 48.1 per cent, 47.9 per cent, 47.0 per cent, and 46.5 per cent. The consumption rate was initially published as 47.4 per cent, and was later revised up several times to 48.2 per cent, 48.5 per cent, 49.3 per cent, and 49.9 per cent. The investment rate for 2020 was initially published as 43.1 per cent, and was subsequently revised down to 42.9 per cent and 42.3 per cent; the consumption rate was initially 54.3 per cent, and was subsequently revised up to 54.7 per cent and 55.4 per cent. The investment rate for 2023 was also revised down from the originally published 42.1 per cent to 41.1 per cent, while the consumption rate was revised up from the originally published 55.7 per cent to 56.8 per cent. All of these revisions moved in the same direction: lowering the investment rate and raising the consumption rate. None of these revisions to the historical data was accompanied by an explanation of the reasons for the revision. Here, the author uses the data from the China Statistical Yearbook 2024 and does not adopt further revisions.
The English term “deflation” originally denotes a general decline in the price level, not specifically a fall in prices caused by monetary contraction. Tight money is only one possible cause of falling prices. In Chinese, however, deflation is translated as “通货紧缩”, with “通货” meaning money in circulation, which makes the term potentially misleading. Read literally, “通货紧缩” translates back into English as “monetary contraction”, rather than deflation in its original sense. Because this usage has long been entrenched, many people, including some economists, have come to treat falling prices as automatic evidence of an insufficient money supply. That is a serious misunderstanding.
The 2024 data are calculated based on the People’s Bank of China’s China Financial Stability Report 2024. The earlier data are calculated based on the People’s Bank of China’s annual stock of debt-based aggregate financing to the real economy and the National Bureau of Statistics’ GDP data.
He Xiaobei: low inflation indicates need for further accommodative monetary policy

Recent data show that China’s CPI have fallen into negative territory for two consecutive months (Mar and April 2025), indicating a growing risk of deflation. However, some economists argue that further monetary easing in China would be “pushing on a string,” unable to encourage borrowers to take on more credit even as growth slows.
Li Xunlei warns against excessive industrial investment amid declining demand and population

Li Xunlei is Chief Economist at Zhongtai Financial International Limited and has worked extensively at other Chinese securities companies, including Junan Securities, Guotai Junan Securities, and Haitong Securities. He is one of the most renowned chief economists among major domestic securities firms in China.
Yu Yongding: There Is No “Consumption-Driven” Growth Model, and China’s Infrastructure Investment Is Far From Saturated

For a growing number of economists, both outside China and increasingly within it, the central question facing the world’s second-largest economy is its exceptionally weak domestic demand. Beijing, at least rhetorically, has moved in the same direction. Over the past two years, “
 | A guest post by
|
“A system endures not by how much it produces, but by how well it remains within what allows it to continue.”
https://conversation.substack.com/p/stability-under-constraint?r=6fuqhc&utm_medium=ios
Someone needs to direct the professor to the crowding-in effects from government investments. We see this in China's deflation and enormous trade surpluses. The crowding-out effects of government spending is the result of entropic spending. Not all government spending are the same.
Has the professor considered deflation has distorted consumption? Consumers are spending more but at lower prices? GDP is not a good measurement of the economy because it is too dependent on prices.
If the professor is concerned about public debt, is it really an issue? The borrowing cost is the lowest in the world. Local government revenues come from sales tax which can be resolved with a little bit of inflation or transfer the debt to the central government since it collects taxes. In the US, taxes are sent back to the local government instead of the central government assuming the debt. It's basically the same thing.
The debt debate is more about oranges and apple when comparing with the US. The US debt only includes the federal debt while China's debt includes both local and central government debts. If the US local debt and federal debt were added up together, it would be greater than China's debt.