
Brussels Blames China. The Data Point Elsewhere
Europe’s trade deficit with China has widened sharply, but sectoral evidence does not support the usual claims about dumping, trade diversion, or a weak renminbi, latest CF40 research shows.
One of the most convenient stories in Brussels today is that Europe is facing a second “China Shock”: a flood of cheap Chinese goods, pushed abroad by overcapacity, subsidies, and weak demand at home.
The data tell a different story.
A new, detailed analysis by the China Finance 40 Forum shows the increase in Chinese exports to Europe has been highly concentrated in a few sectors—electric vehicles, batteries, photovoltaic products, and chemicals—where Europe’s own green transition and energy shock created real demand. Meanwhile, the decline in European exports to China has not been driven mainly by a shrinking Chinese market, but by China’s industrial upgrading and import substitution.
In other words, the imbalance is not simply something China has done to Europe. It is also something Europe’s own energy costs, industrial structure, and transition choices have helped produce.
The authors of the research are
GUO Kai, Executive President and Senior Fellow of the CF40. Before joining the CF40, he was an economist at the International Monetary Fund in Washington DC and then worked at the People’s Bank of China in various capacities, including leading positions in the Monetary Policy Department and the International Department. His main research areas include the Chinese economy and its macroeconomic policies as well as international finance. He is the author of three popular Chinese economics books and multiple academic papers in various English and Chinese journals. He holds a PhD degree in economics from Harvard University.

WANG Jiankun, Research Fellow at China Finance 40 Institute. Before joining CF40, he worked as a consultant at the World Bank. His research interests include international trade and investment. He holds a Master of Public Policy degree from Georgetown University and a bachelor’s degree from Zhejiang University.

Founded in 2008, China Finance 40 Forum (CF40) is a leading independent think tank focused on policy research in macroeconomics and finance. Its core membership consists of 40 leading experts from government, financial institutions and academia around the age of 40. In 2021, the CF40 Institute was established to strengthen CF40’s research capacity. In 2024, the CF40 Institute introduced an original research product, CF40 Research, aimed at providing independent insights into China’s macroeconomy, policy trends, financial market dynamics, and global affairs. CF40 Research currently features English product series, including Policy Brief, Commentary, and Podcast.

Below is a full translation of the policy brief. The original Chinese document is also available for download.
中欧贸易失衡为何扩大
Why Has the China–EU Trade Imbalance Widened?
WANG Jiankun, GUO Kai
CF40 Institute
Abstract: The widening China–EU trade imbalance has become one of the main concerns in bilateral economic relations in recent years. The dominant explanations point to spillovers from overcapacity in China, trade diversion caused by China–U.S. trade frictions, a price advantage stemming from a weak renminbi, and weaker Chinese domestic demand reducing EU exports to China. This article finds that these explanations are not supported by the sectoral and trade data.
On the EU import side, the rise in China’s exports to the EU has not been broad-based. It has been highly concentrated in the “new trio” (electric vehicles, lithium-ion batteries, and photovoltaic products) and in chemicals. Volume and price data do not support the assessment that Chinese goods have been dumped at low prices, either. The export growth of the new trio and chemicals reflects, to a greater degree, structural changes within the EU itself: The green transition has raised demand for new energy products, while the energy crisis has increased production costs in sectors such as chemicals and strengthened reliance on external supply.
On the EU export side, Chinese domestic demand in the sectors where EU exports are concentrated continued to expand between 2021 and 2024. The weakness in EU exports to China was not primarily due to an overall contraction in the Chinese market. The main driver was faster import substitution in a context of declining import dependence.
The widening EU trade deficit with China is essentially the combined result of China’s industrial upgrading and Europe’s energy constraints. Trade protection measures such as tariffs alone are unlikely to address its structural roots.
I. Why has the China–EU trade deficit widened sharply over the past five years?
In 2025, the EU’s goods trade deficit with China widened to EUR 359.3 billion, up by nearly 15% from EUR 312.2 billion in 2024, and more than double the deficit of EUR 165.0 billion recorded in 2019. In fact, the rapid widening of the deficit is mainly a recent development rather than a long-running trend over the past decade. Between 2016 and 2019, the EU’s trade deficit with China remained broadly stable at around EUR 160 billion (Figure 1). The turning point came after 2020, when the deficit began to widen rapidly and persistently, driven by both imports and exports. This has made the China–EU trade imbalance a main concern in bilateral economic relations.
On China’s export side, exports to the EU rose markedly after the pandemic in 2020. In 2022, against the backdrop of the Russia–Ukraine conflict, they surged to a record high of EUR 628.9 billion (Figure 1). Exports fell temporarily to EUR 520.5 billion in 2023, but that did not alter the broader upward trend. In 2024, China’s exports to the EU recovered to EUR 525.7 billion. In 2025, they rose further to EUR 558.8 billion, an increase of 6% year on year and about 54% relative to 2019.
On China’s import side, EU exports to China continued to weaken. They peaked at EUR 231.0 billion in 2022 and then declined for three consecutive years. In 2025, EU exports to China fell to EUR 199.5 billion, down 7% from EUR 213.5 billion in 2024 and 14% below the 2022 peak. The pace of decline also accelerated year by year.
This pattern of rising Chinese exports and falling EU exports is even clearer in market shares (Figure 2). China’s share in the EU’s extra-EU imports rose from 18.7% in 2019 to 22.2% in 2025, showing that China’s position among the EU’s external suppliers continued to strengthen. Over the same period, China’s share of the EU’s global exports fell from 10.5% in 2020 to 7.5% in 2025, indicating that the Chinese market became less important for EU exporters.
It is also worth noting that, from China’s own export perspective, the EU’s share in China’s total exports declined from 17.2% in 2019 to 14.8% in 2025. This suggests that China’s export destinations have become more diversified and that its export dependence on the EU market has also fallen.
The widening gap between exports and imports shows that the China–EU trade imbalance is no longer a short-term fluctuation. It has become increasingly structural.
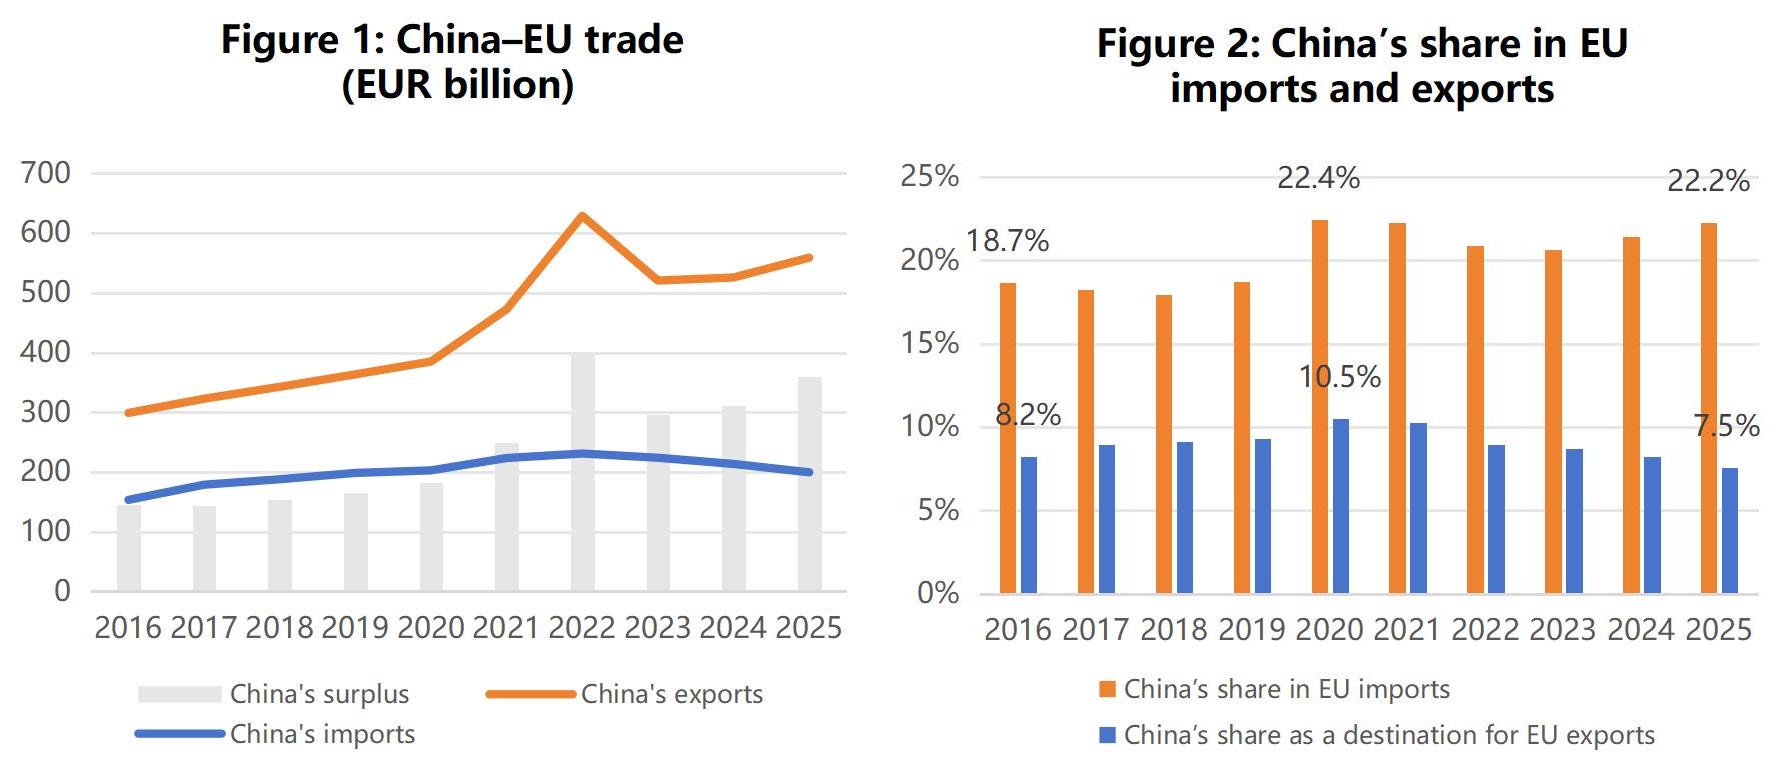
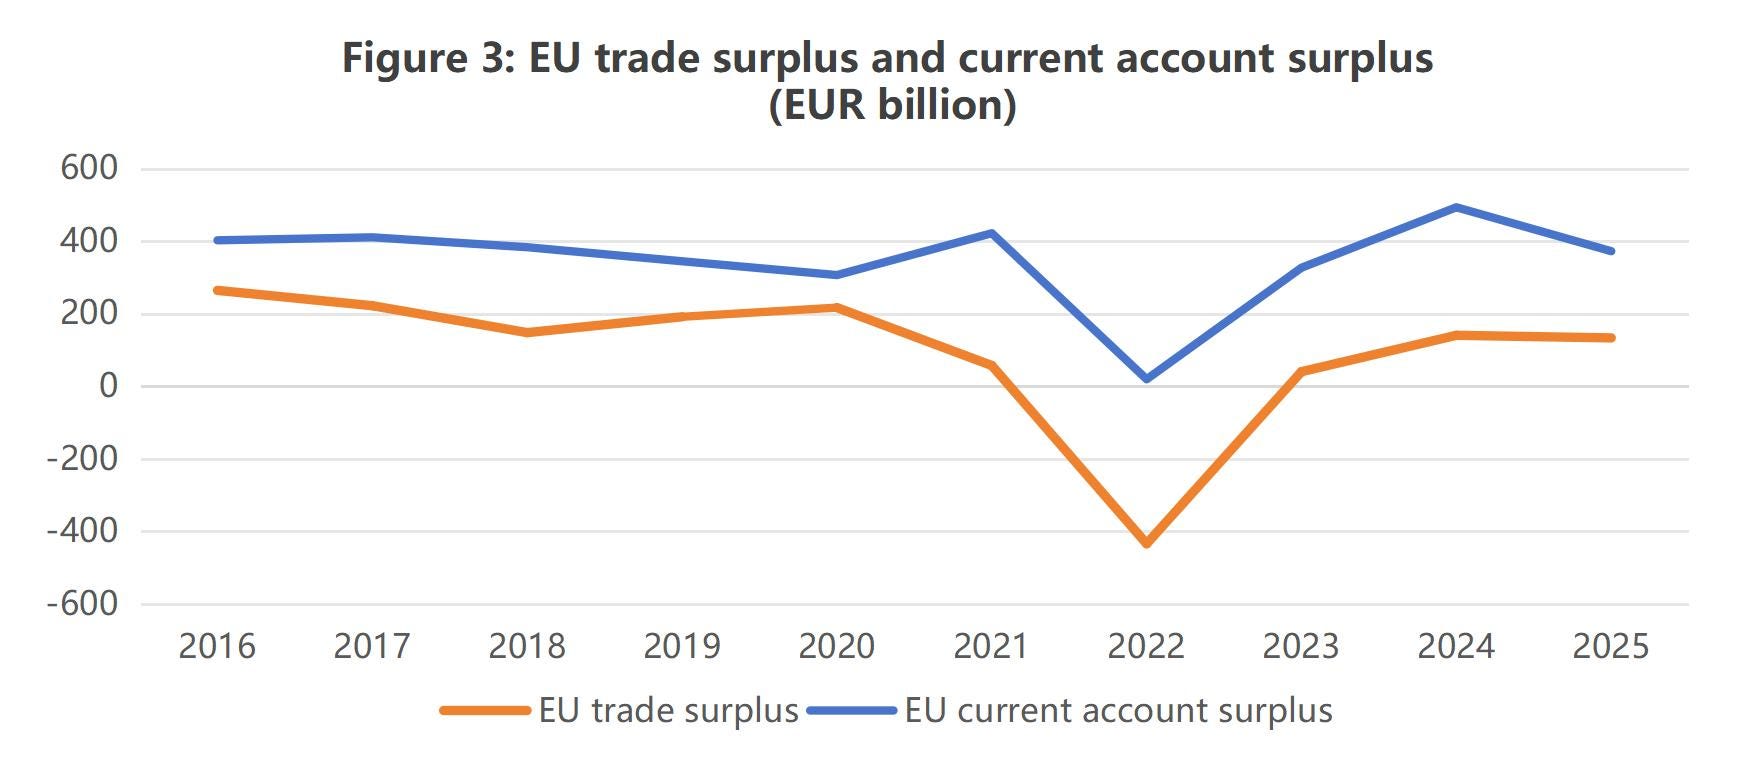
Figure 3 shows that the EU as a whole continued to record a trade surplus and a current account surplus vis-à-vis the rest of the world. Both weakened temporarily during the 2022 energy crisis, but then recovered quickly and returned to high levels. This means that the widening bilateral deficit with China did not coincide with a broader deterioration in the EU’s external trade and current account position. The widening deficit with China is therefore a specific bilateral imbalance, rather than part of a general weakening in the EU’s external position. To understand why it widened, we need to look at the bilateral trade relationship more closely.
In current European policy debates, four explanations are most often used to account for the widening China–EU trade imbalance.
The first argues that Chinese industrial policy has led to large-scale capacity expansion, with overcapacity flooding overseas markets, including the EU, with low-priced goods.
The second holds that, after China–U.S. trade tensions escalated, goods originally destined for the U.S. market were redirected to the EU, amounting to low-price dumping.
The third points to the renminbi, arguing that its persistent weakness has given Chinese manufacturing a systematic price advantage in export markets.
The fourth focuses on the demand side in China. Since 2021, the property downturn has persistently weighed on domestic demand, weakening China’s capacity to absorb imports and directly narrowing the space for EU exports.
However, this article finds that sectoral and trade data do not support these explanations.
China’s exports to the EU have not expanded across the board, nor has low-price competition been the main feature. Export growth in recent years has been concentrated in a small number of sectors. Meanwhile, the weakness in EU exports to China has reflected lower Chinese import dependence and faster import substitution, rather than an overall contraction in the Chinese market.
This article argues that the widening trade imbalance reflects the combined effect of changes in EU demand and changes in China’s supply structure. On the one hand, the EU’s energy transition has raised industrial costs and increased demand for China’s new trio and chemicals. On the other hand, China’s industrial upgrading has accelerated import substitution, reduced demand for imported products, and narrowed the room for EU exports to China. At the same time, the widening bilateral imbalance has not altered Europe’s broader external surplus position. As the EU’s deficit with China increased, its surplus with other trading partners also rose.
II. China’s Export Side: Driven by the EU’s Energy Transition Rather Than Low-Price Dumping
2.1 Volume and price data do not support the low-price dumping narrative
Looking at the overall trend in China’s exports to the EU from 2016 to 2025, price data do not support the argument that exchange rate movements led to low-price dumping. This section uses China, Japan and Korea as a benchmark group, since all three export broadly similar product categories to the EU, with machinery and electronics, chemicals, and transport equipment accounting for a large share. Measured in euro prices actually paid by EU buyers, export price indices for all three countries moved closely together and remained broadly flat in the 110–120 range after 2023 (Figure 4).1
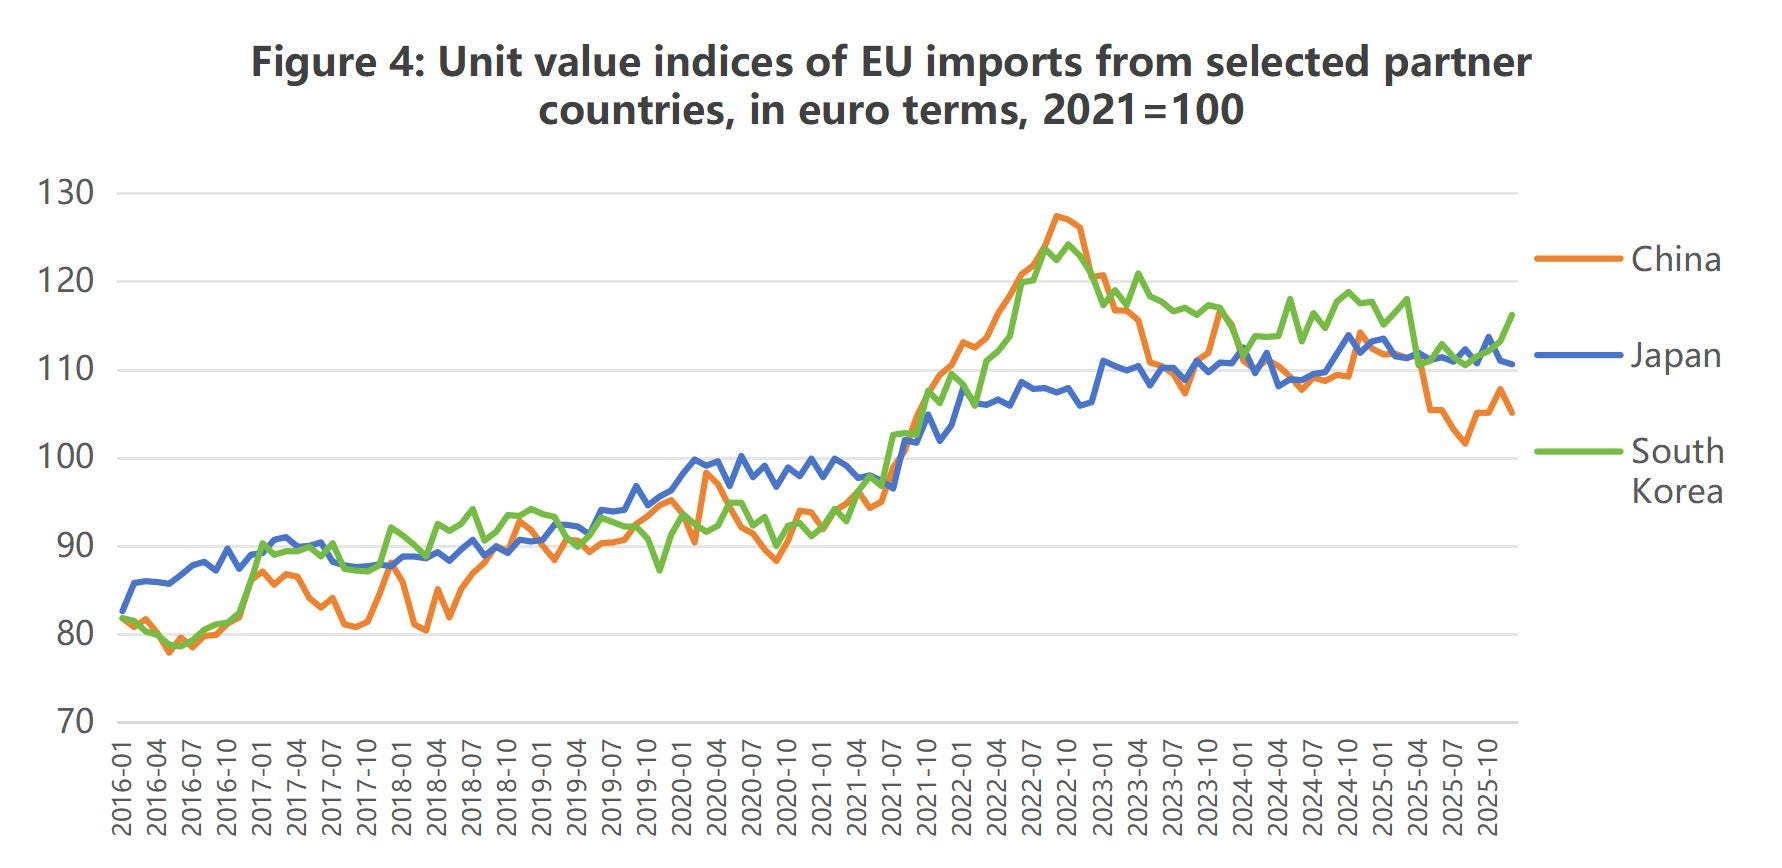
The reason for these similar trends is that the yen and the won depreciated sharply over the same period. Once converted into euro terms, domestic inflation in Japan and Korea was offset by exchange rate depreciation, making price trends for EU buyers broadly similar across the three countries. At the same time, the renminbi strengthened in nominal terms against the euro between 2019 and 2022, and only weakened visibly by 2025. In other words, the expansion of China’s exports to the EU took place during a period when the renminbi was relatively strong rather than weak. Although the euro-denominated price index of Chinese goods declined somewhat from 2025 onwards due to exchange rate movements, widening the price gap with Japan and Korea, this looks more like a recent development than a persistent driver of market share gains since 2020.
From 2016 to 2024, China did not show a steadily widening price advantage. If the exchange rate had been the main driver of exports, the euro prices of Chinese products should have diverged clearly from those of Japan and Korea from 2020 onwards. Yet the data show that the three moved broadly in step. This suggests that China did not gain a price advantage through exchange-rate movements and that the exchange rate explanation lacks support from the price data. In fact, in 2022, when China’s exports to the EU jumped sharply, the increase in the price of Chinese goods was much larger than for Japan and also larger than for Korea.
Volume data also do not support the view that China gained market share through low prices. If price competitiveness had been the main driver, export volumes in Chinese manufacturing should have risen strongly as prices weakened over the past five years. However, the export volume and unit value indices shown in Figure 5 do not support that conclusion.2
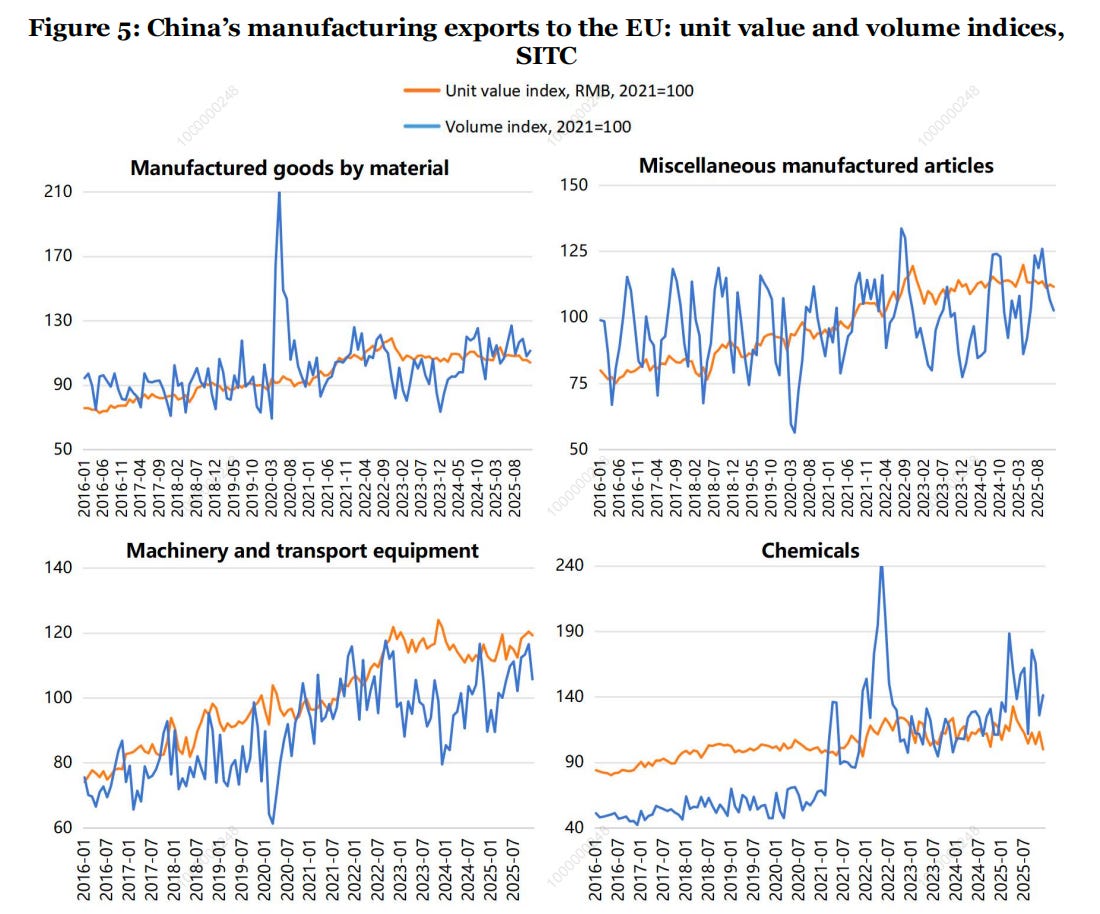
Miscellaneous manufactures and material-based products are the most telling. Miscellaneous manufactures include clothing, footwear, furniture, and toys, the sectors most readily associated with “low-cost Chinese manufacturing.” Material-based products include traditional industrial goods such as steel, non-ferrous metals, rubber, and plastics, another major base of China’s industrial exports. If low-price competition had been the general mechanism driving export growth to the EU, these two sectors would have been the most likely to show sustained volume expansion. Yet Figure 5 shows that, apart from temporary fluctuations during the 2020 pandemic, their export volume indices remained within a relatively narrow range from 2016 to 2025, with no sustained upward trend. This suggests that even in the sectors most closely associated with “low-cost shock”, there was no clear volume expansion.
By contrast, machinery and transport equipment, and chemicals, were the sectors where export volumes increased more clearly. Their export volume indices rose overall after 2021, but their unit value indices did not fall as volumes increased. On the contrary, prices also remained on an upward path. In other words, export growth in these sectors was not driven by persistent price cuts. Volumes rose while prices remained sustained. This suggests that export growth in these two sectors is better explained by changes in EU demand and in China’s supply structure than by price advantages.
2.2 70% of the increase in market share came from the new trio and chemicals
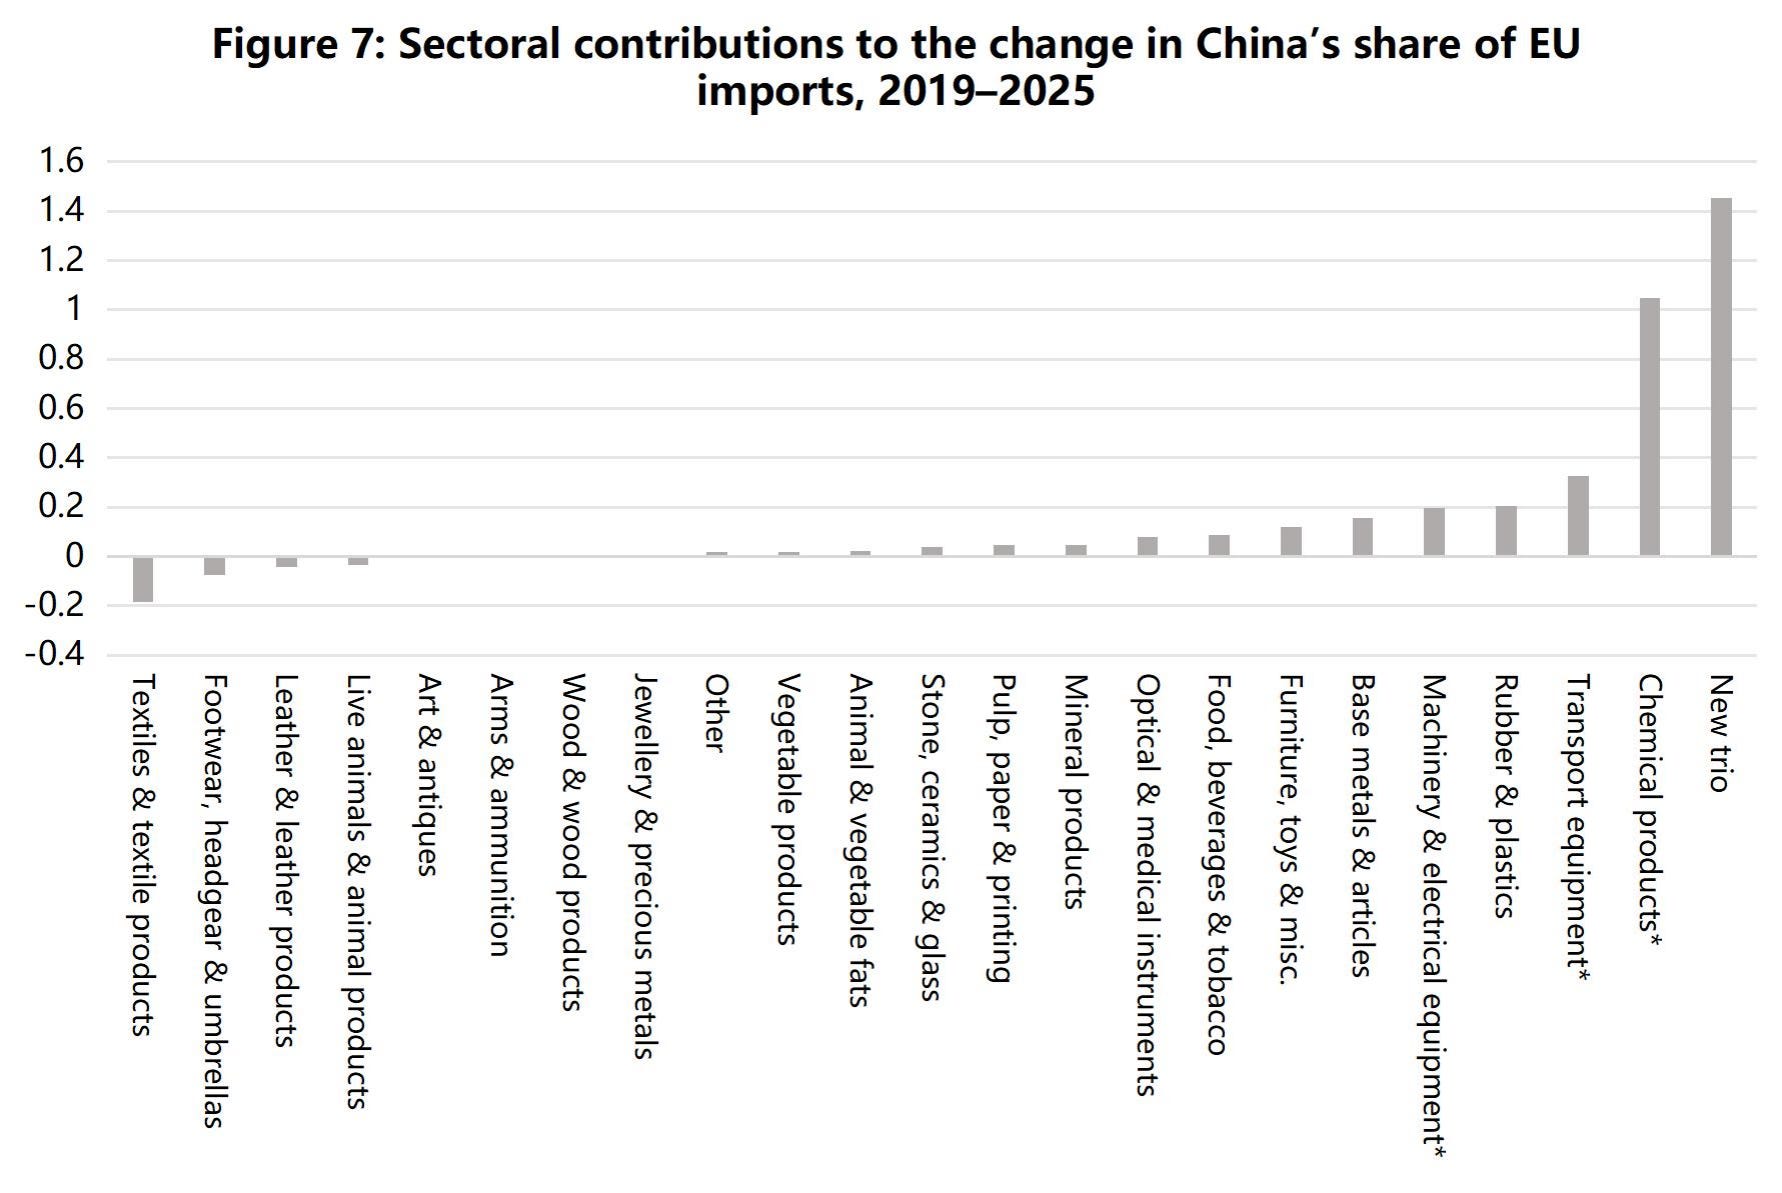
Building on the volume and price analysis, a closer look at sectoral export developments shows even more clearly that this expansion was not evenly distributed. Figure 6 shows that between 2019 and 2025, changes in China’s share of EU imports varied widely across 21 HS chapters and the separate category of the “new trio”.3 Only eight sectors recorded increases of more than 5 percentage points. These were the new trio, chemicals, transport equipment, plastics and rubber, stone, ceramics and glass, pulp and printed products, leather products, and wood products. The new trio stood out most, with China’s share in EU imports rising by around 26 percentage points. The remaining sectors changed only modestly, and some even recorded declines. This shows that the rise in China’s market share in the EU was not a broad-based acceleration across sectors. It was concentrated in selected industries.
Structurally, the sectors with the fastest gains in imports share were strongly concentrated in specific industrial groups. Of the eight sectors with the largest gains, four are classified by the EU as “Energy-Intensive Industries”, including “pulp, paper and printing”, “chemicals”, “stone, ceramics and glass”, and “plastics and rubber”. Together with the new trio and the related automotive component chain, this shows that the sectors where China penetrated the EU market most rapidly in recent years were concentrated in two broad groups: 1) new energy-related products, 2) chemicals and certain energy-intensive industries. This pattern is not random. It reflects a clear industrial structure.
At the same time, some sectors evolved in ways that do not fit the usual stereotype. Machinery and electrical equipment is the largest category in China’s exports to the EU, yet China’s share in EU imports in this sector did not continue to rise between 2019 and 2025. It fell slightly, by 0.3 percentage points. Export value increased by nearly EUR 58 billion over the six-year period, but this was mainly absorbed by overall growth of the EU market and did not translate into additional market share. Textiles recorded only a small increase, much weaker than in energy-intensive industries, and showed no sustained upward trend.
These are precisely the sectors most often associated with the narrative that Chinese exports were redirected to Europe after China–U.S. trade tensions escalated. Since 2018, the United States has imposed four rounds of Section 301 tariffs on Chinese goods, covering a very broad range of products, from industrial machinery and semiconductors to apparel and footwear. If trade diversion had been the main driver of China’s export expansion to the EU, one would expect a more even acceleration across sectors under such broad tariff coverage. The EU market does not show such a pattern. At a minimum, this shows that describing recent China–EU trade changes simply as broad-based trade diversion triggered by the China–U.S. trade war is inconsistent with the sectoral evidence.
There are also sectors where China’s share increased rapidly within the sector, but whose contribution to overall export growth and to the widening trade deficit was limited. Leather and wood are examples. China’s share in EU imports in these sectors rose by 9.6 and 6.3 percentage points respectively, but the increase in export value was only around EUR 0.7 billion in each case. Their market share gains mainly reflected a contraction in the EU’s total imports in these sectors, which lifted China’s relative position compared with other suppliers, rather than a large increase in China’s exports in absolute terms. In other words, a rise in sectoral market share does not necessarily mean that it matters equally in aggregate value.
Sectoral market share changes alone are therefore not sufficient to identify which sectors actually drove the increase in China’s overall share in EU imports. Once the focus shifts back from within-sector market shares to China’s overall share in EU extra-EU imports, the driving forces become much more concentrated.
Between 2019 and 2025, China’s share in EU extra-EU imports rose from 18.73% to 22.25%, an increase of 3.52 percentage points. Of this, the new trio accounted for 1.45 percentage points and chemicals for 1.05 percentage points. Together, they contributed 2.5 percentage points, or around 70% of the total increase (Figure 7). The other 20 sectors together contributed only around 1 percentage point, spread across transport equipment, plastics and rubber, machinery and electrical equipment, and base metals, with no single sector contributing more than 0.35 percentage points. Some of these gains were also partly offset by declines in sectors such as textiles and footwear & headgear.
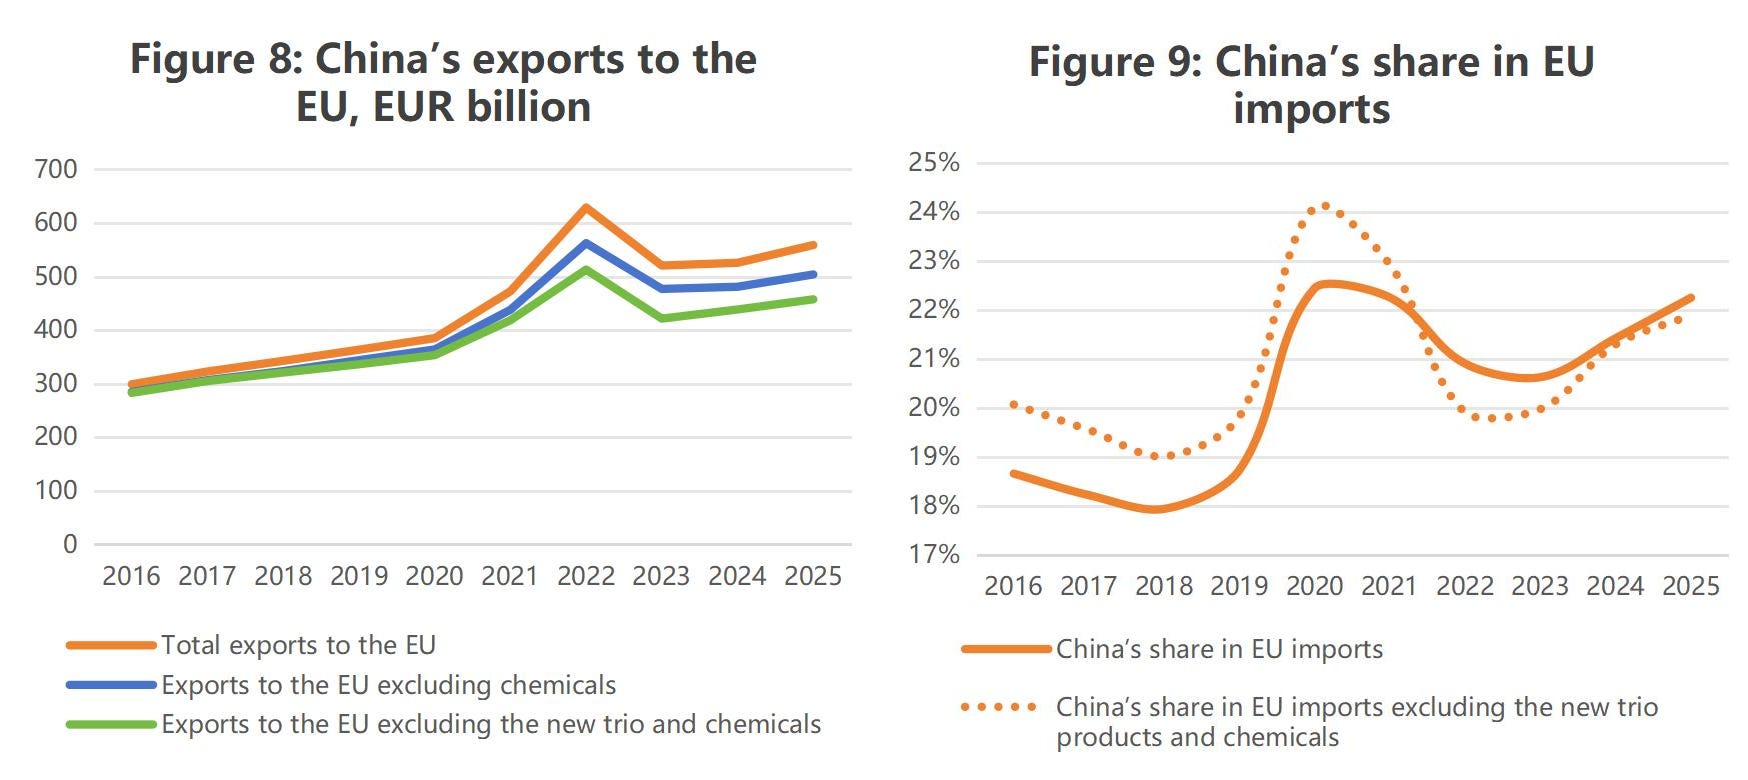
The same concentration is visible in absolute export values. In Figure 8, the three lines represent total Chinese exports to the EU, exports excluding chemicals, and exports excluding both the new trio and chemicals. The three lines nearly overlapped before 2019, and then gradually diverged. By 2025, the new trio and chemicals together accounted for about EUR 95 billion of additional exports. Excluding these two groups, the increase in China’s exports to the EU broadly followed the pre-2019 trend and did not show a clear acceleration.
The concentration is even clearer in share terms (Figure 9). The solid line, covering all products, rose from around 19% to 22%, an increase of more than 3.5 percentage points. The dashed line, excluding the new trio and chemicals, rose only from around 20% to 22%, with an increase of less than half that size. This means that, without the new trio and chemicals, China’s share in EU imports would have increased only moderately. The rest of the export basket did not show a marked acceleration in market share gains.
2.3 The EU’s energy transition and the contraction of domestic capacity were the real drivers
The increase in China’s exports of the new trio and chemicals has a common background: major changes in the EU’s energy landscape. Since the second half of 2021, Europe’s energy situation has changed sharply. This has both raised domestic production costs and reshaped the EU’s demand for external goods.
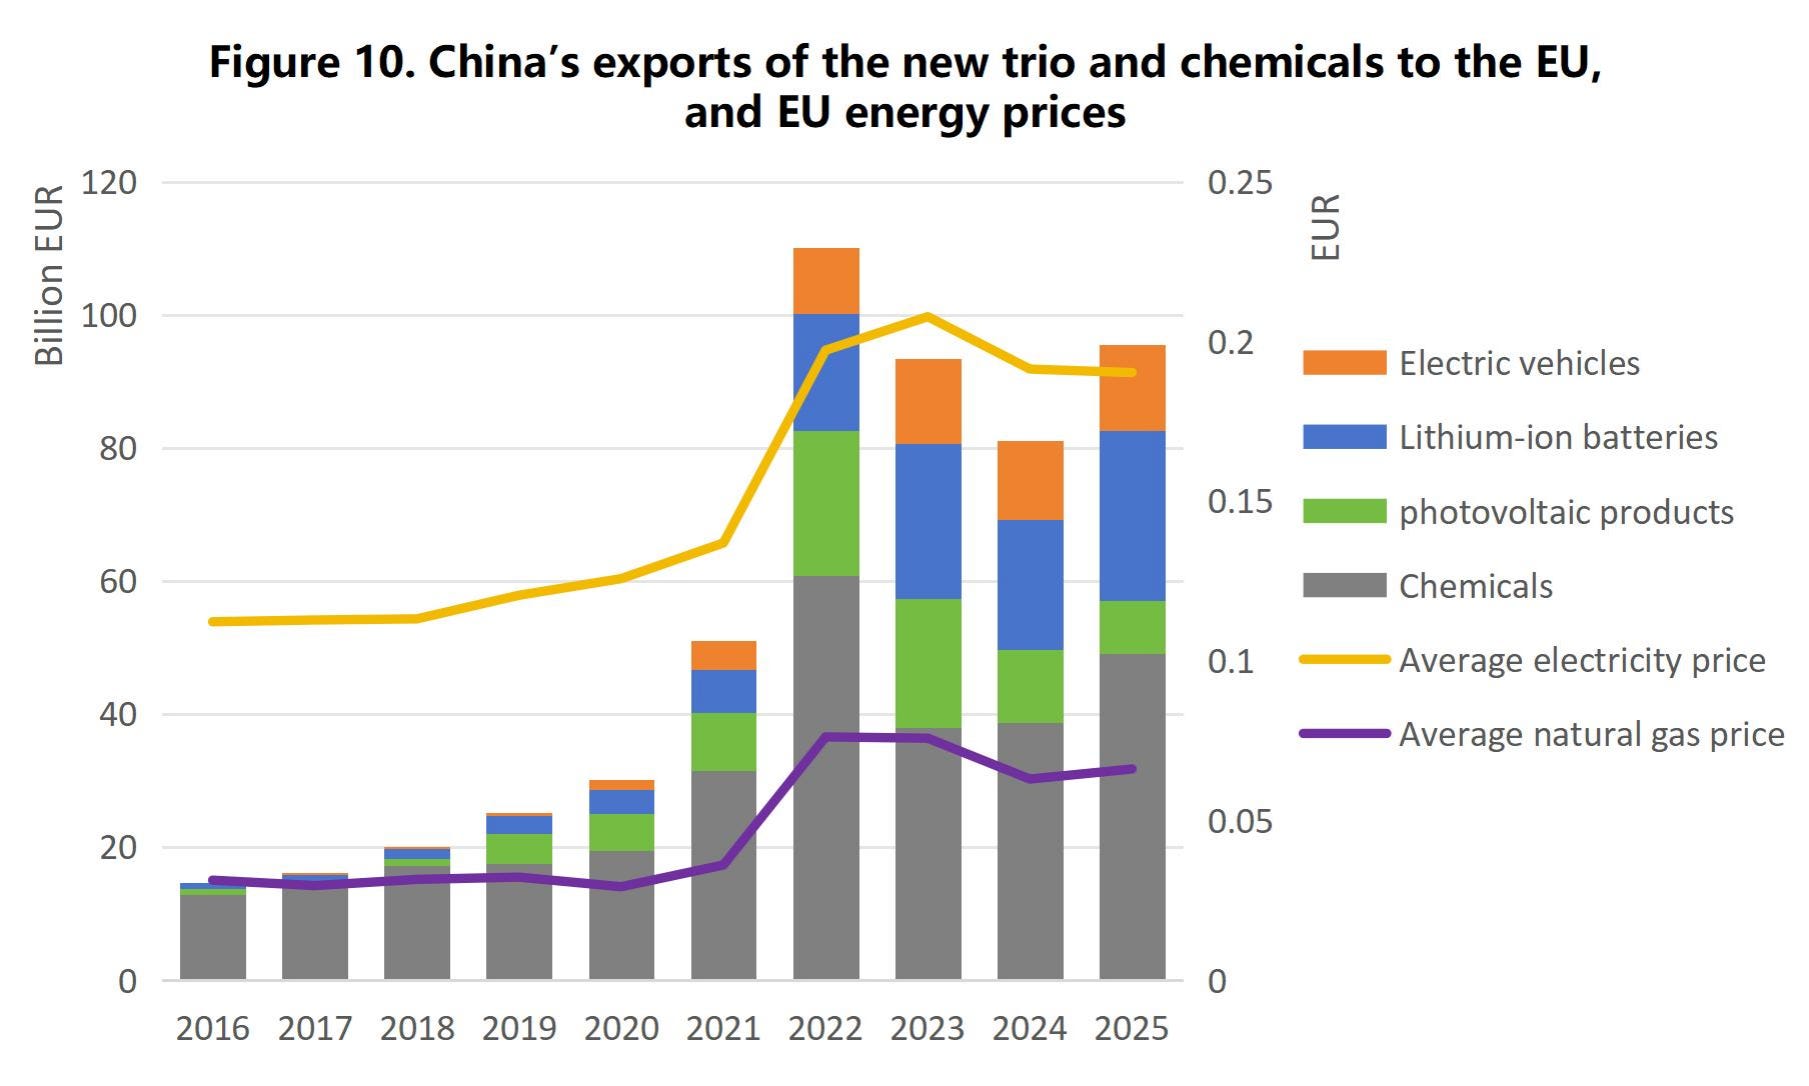
Figure 10 shows this relationship clearly. Electricity and natural gas prices in the EU started to rise rapidly in the second half of 2021.
At the same time, China’s exports of the new trio and chemicals to the EU also increased significantly. When the energy crisis peaked in 2022, exports in both product groups jumped further. This suggests that recent growth in China’s exports to the EU was not an isolated trade phenomenon. It was closely linked to broader macro-level factors, including Europe’s energy crisis and green transition.
This link mainly worked through two channels.
The first was cost-driven substitution. The energy crisis not only changed the EU’s demand structure. It also sharply raised production costs in the European industry, especially in chemicals. In 2025, the EU non-household electricity price reached EUR 0.19 per kilowatt-hour, nearly 50% higher than the EUR 0.13 recorded in 2021. For the chemicals industry, which relies heavily on natural gas and electricity, this cost shock was direct and severe. The economics of producing many chemical products in Europe deteriorated markedly. Firms, therefore, became more inclined to cut output, suspend production, and turn to external sourcing. The increase in China’s chemical exports to the EU is better understood as a shift toward imports after European domestic supply contracted. The parallel rise in chemical exports and energy prices between 2021 and 2025 shown in Figure 10 is consistent with this explanation.
The second channel was demand created by the energy transition. After the outbreak of the Russia–Ukraine conflict, the EU sharply reduced its imports of Russian energy. Before that, around 40% of the EU’s imported natural gas came from Russia. Against this backdrop, reducing dependence on external fossil energy, strengthening energy autonomy, and accelerating the green transition quickly became EU policy priorities. One direct consequence was a marked rise in EU demand for products such as photovoltaic products, batteries, and electric vehicles. As the world’s largest producer of photovoltaic products, batteries, and electric vehicles, China has the most complete supply chains and the strongest capacity for large-scale manufacturing in these industries. It naturally became the primary external source of this new demand. The expansion of the new trio was driven mainly not by price competition, but by the rapid emergence of EU demand associated with the energy transition, which China’s upgraded industrial supply capacity was well placed to meet.
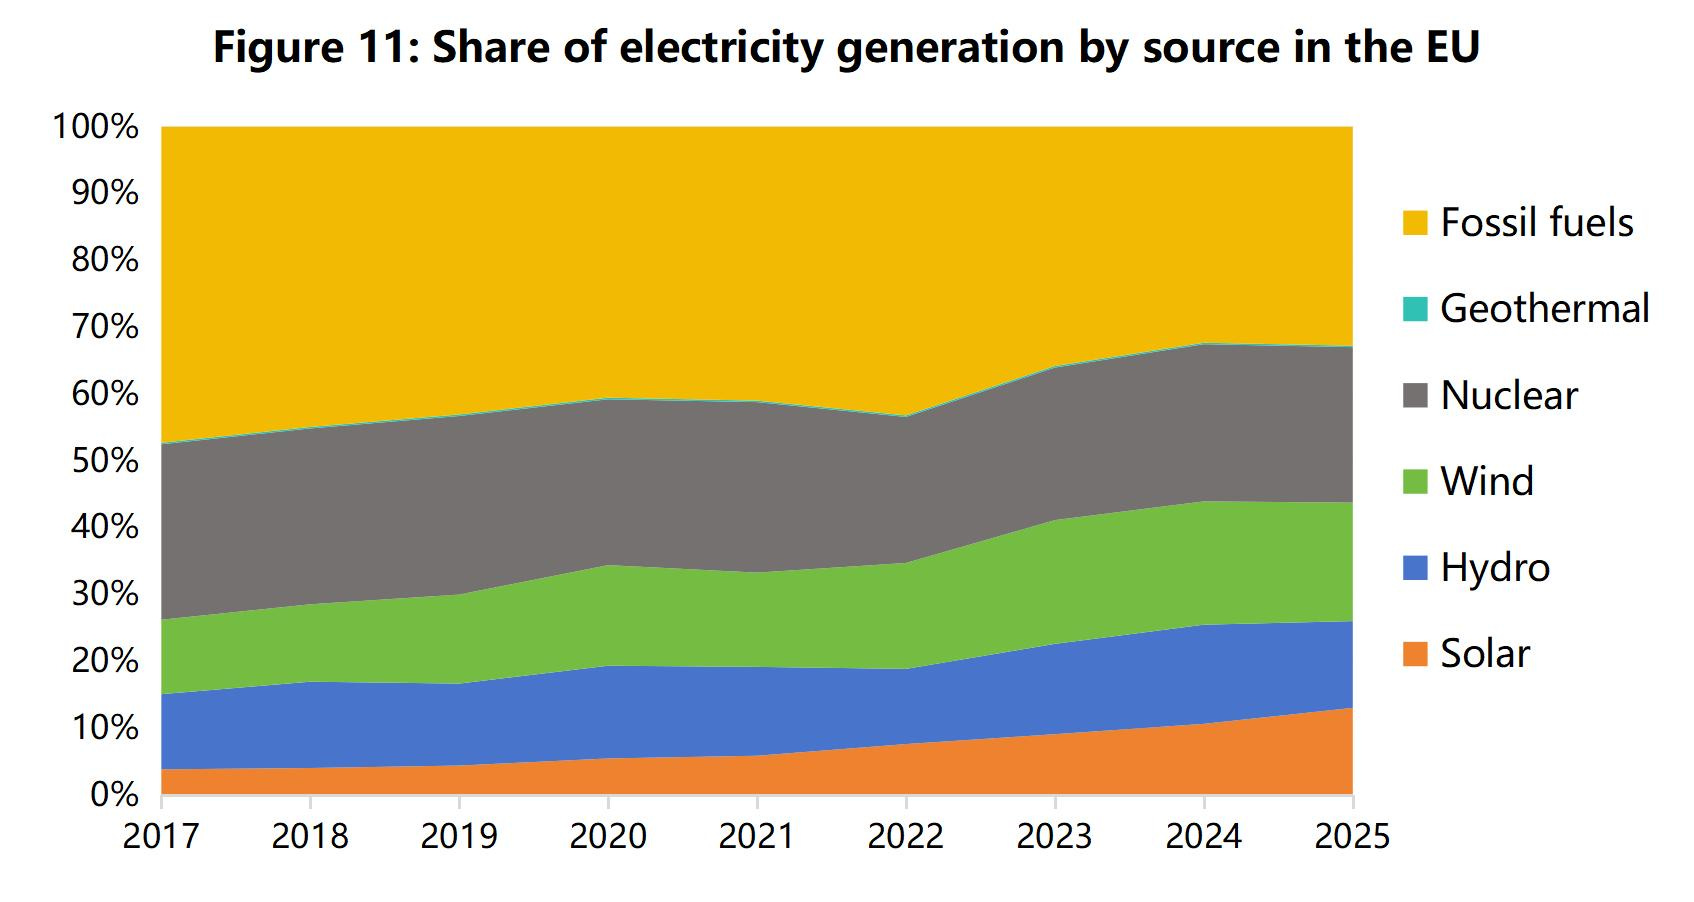
Figure 11 further shows that this shift in demand was not merely a short-term emergency response. It formed part of the EU’s longer-term energy-transition path. Since 2017, the share of wind and solar power in EU electricity generation has continued to rise, reaching 31% by 2025. The share of clean energy in total power generation has also increased to around two-thirds. EU demand for new energy equipment and related supply-chain products rests on a clear policy and structural foundation. That is why exports of the new trio remained at a high level even after European energy prices retreated from their crisis peaks after 2023.
In fact, Chinese firms have already built strong advantages in costs, industrial organisation, and complete supply chains. The increase in European imports of electric vehicles, batteries, and photovoltaic products reflects not just low prices but also the real competitiveness of these products in performance, delivery capacity, and scale. Subsidies may have affected the pace of development in some industries, but they cannot by themselves explain why the EU has continued to import these products in large volumes even as tariffs have risen and scrutiny has tightened. The main reason is that Chinese firms have already developed market-tested price-performance advantages in these industries, while the EU itself has generated real and sustained demand in the course of the energy transition.
III. China’s Import Side: Faster Import Substitution, Not Weak Domestic Demand
The previous section explained why China’s exports to the EU increased. This section turns to the question of why EU exports to China weakened.
The decomposition results show that, in the sectors where EU exports to China are concentrated, China’s apparent consumption continued to expand overall. The main reason for the decline in EU exports was not shrinking Chinese demand, but rather China’s industrial upgrading and faster import substitution, which systematically reduced the Chinese market’s dependence on imported EU products.
3.1 Analytical framework
This section applies a four-factor multiplicative decomposition to changes in EU exports to China. The four factors are Chinese domestic demand, import penetration, EU share in China’s total imports, and the bilateral exchange rate. The full method and variable definitions are set out below.
For any given sector, EU exports to China can be expressed as the product of three factors:
EU exports to China = China’s domestic demand × (China’s total imports / China’s domestic demand) × (EU exports to China / China’s total imports) = China’s domestic demand × import penetration × EU share
After cancelling the numerator and denominator terms, the left-hand side is simply EU exports to China. Taking natural logarithms on both sides of the identity and differencing over time (2024 minus 2021) gives an additive decomposition of growth rates:
Δln(EU exports to China) = Δln(domestic demand) + Δln(import penetration) + Δln(EU share)
This identity holds under any currency denomination, but the choice of currency affects the economic interpretation of the factors. If all values are measured in U.S. dollars, the roughly 8.5% depreciation of the euro against the U.S. dollar between 2021 and 2024 would reduce the dollar value of EU exports and exaggerate the decline. This article measures China’s domestic demand in renminbi, which is the natural currency for the Chinese market, while keeping EU exports to China on the left-hand side in euro, which reflects the actual revenue of European exporters. The EUR/RMB exchange rate is then introduced as a separate fourth term so that exchange-rate movements can be distinguished from underlying changes in market structure:
EU exports to China (EUR) = China’s domestic demand (RMB) × import penetration × EU share (RMB) ÷ (EUR/RMB)
Δln(EU exports to China, EUR) = Δln(China's domestic demand, RMB) + Δln(import penetration) + Δln(EU share, RMB) − Δln(EUR/RMB)
The four factors are defined as follows:
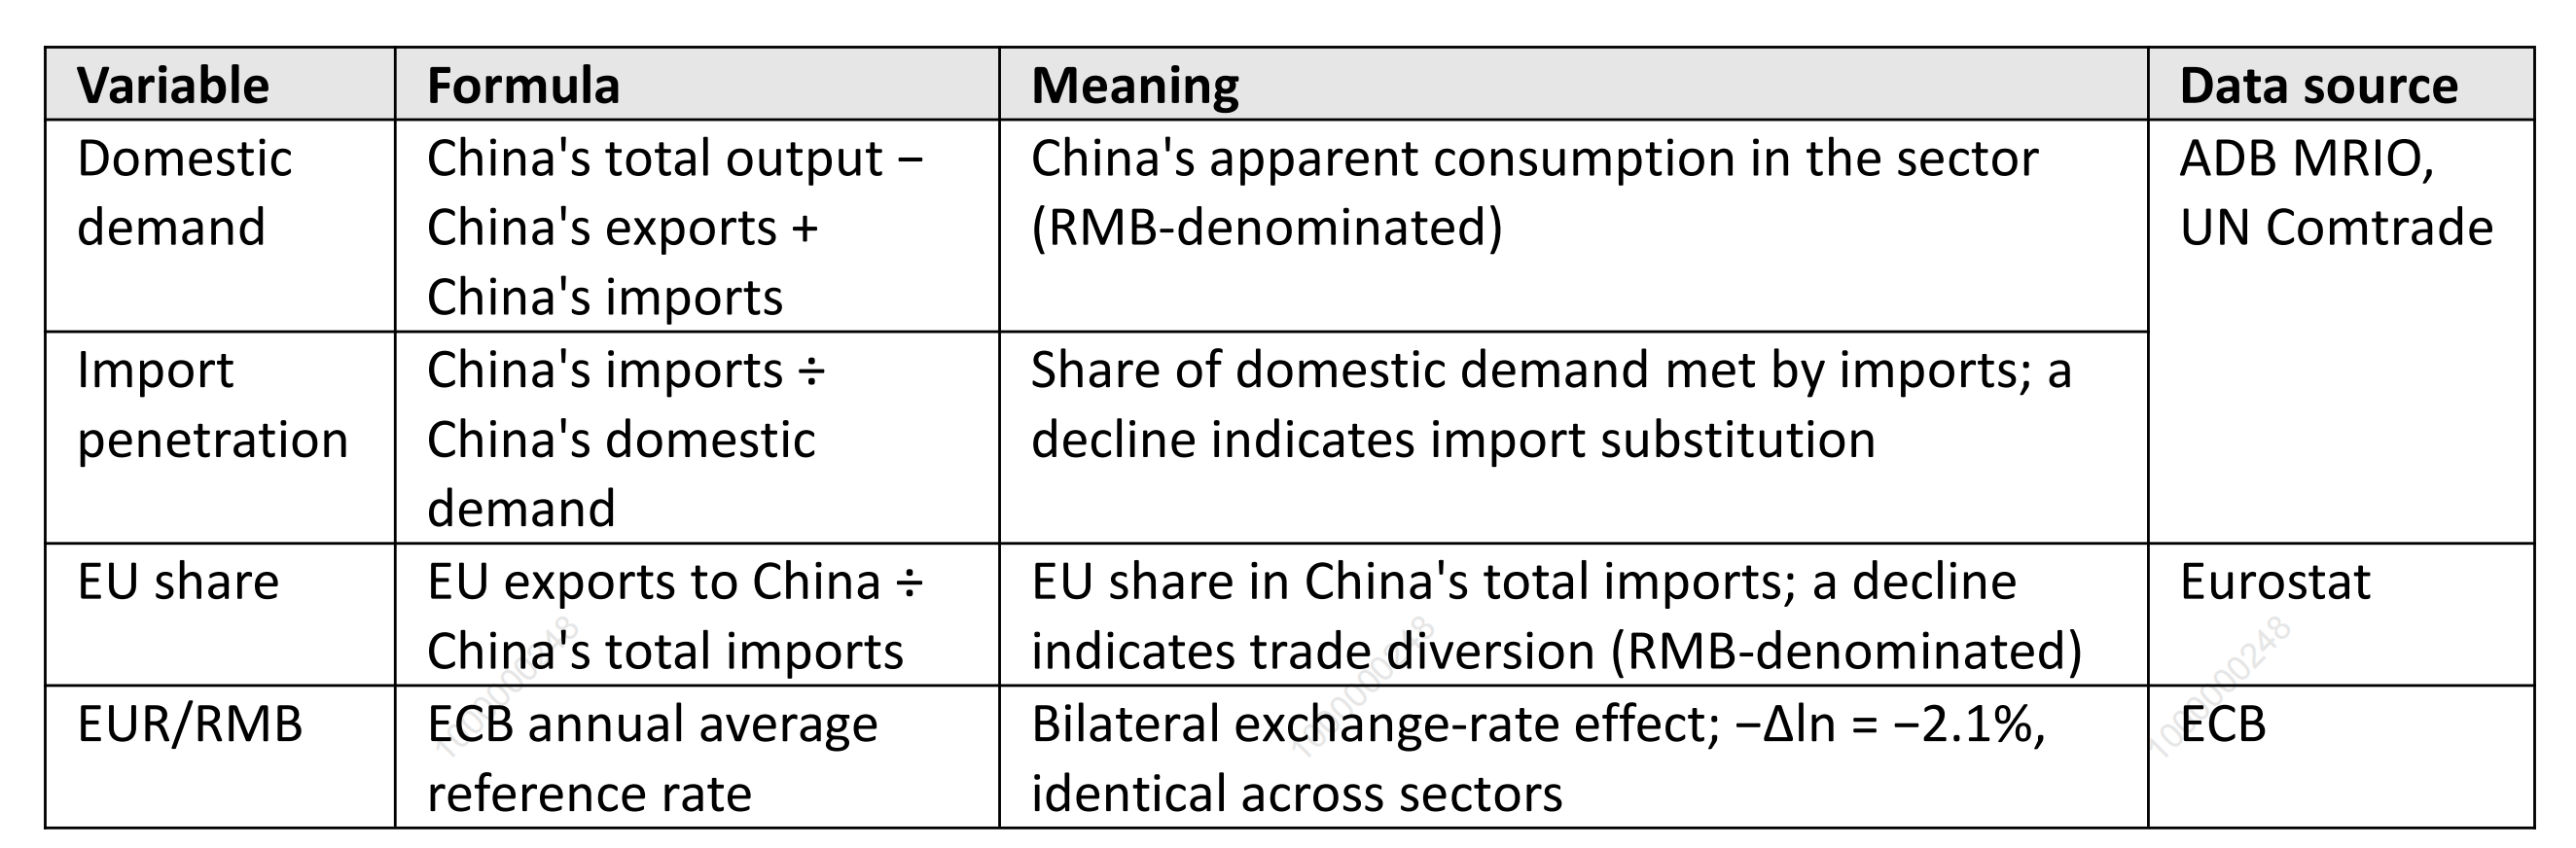
In this identity, China’s domestic demand is measured by apparent consumption, defined as total output + imports − exports. It captures the total volume of goods in a sector absorbed by the Chinese market, including both final use and intermediate inputs used in other sectors.
This article uses apparent consumption rather than value added or final demand because it corresponds more closely to the denominator of import penetration: both are intended to measure total domestic absorption of sectoral products. Value added captures only newly created value within the sector and does not measure total domestic use. In import-intensive sectors, imports may even exceed value added, making value added a poor gauge of the share of imports in domestic absorption. Final demand is also too narrow. Many goods, such as machinery components, are not consumed directly by final users but enter production as intermediate inputs. Using final demand as the denominator would therefore systematically understate domestic absorption and overstate import penetration.
To construct apparent consumption at the sector level, the analysis uses total output from the ADB MRIO input-output tables and combines it with China’s trade data from UN Comtrade to calculate apparent consumption and import penetration for each sector. The ADB MRIO uses the 35-sector ISIC Rev.3 classification, of which c1 to c16 are goods sectors. Because the ADB has not published official data for 2025, the analysis covers 2021 to 2024.
EU exports to China are taken from Eurostat, while China’s import data come from UN Comtrade. Because trade data and input-output tables use different classification systems—HS for products and ISIC for industries—they cannot be matched directly. The HS2 data are therefore mapped into 15 IOT goods sectors. Eurostat applies statistical confidentiality to some HS2 sub-items, so the sum of the sectoral details is smaller than the published total. After the mapping, this residual is combined with the items that originally belong to c16, “other manufacturing”, and c16 is defined residually as c16 = total − Σ(c1–c15).
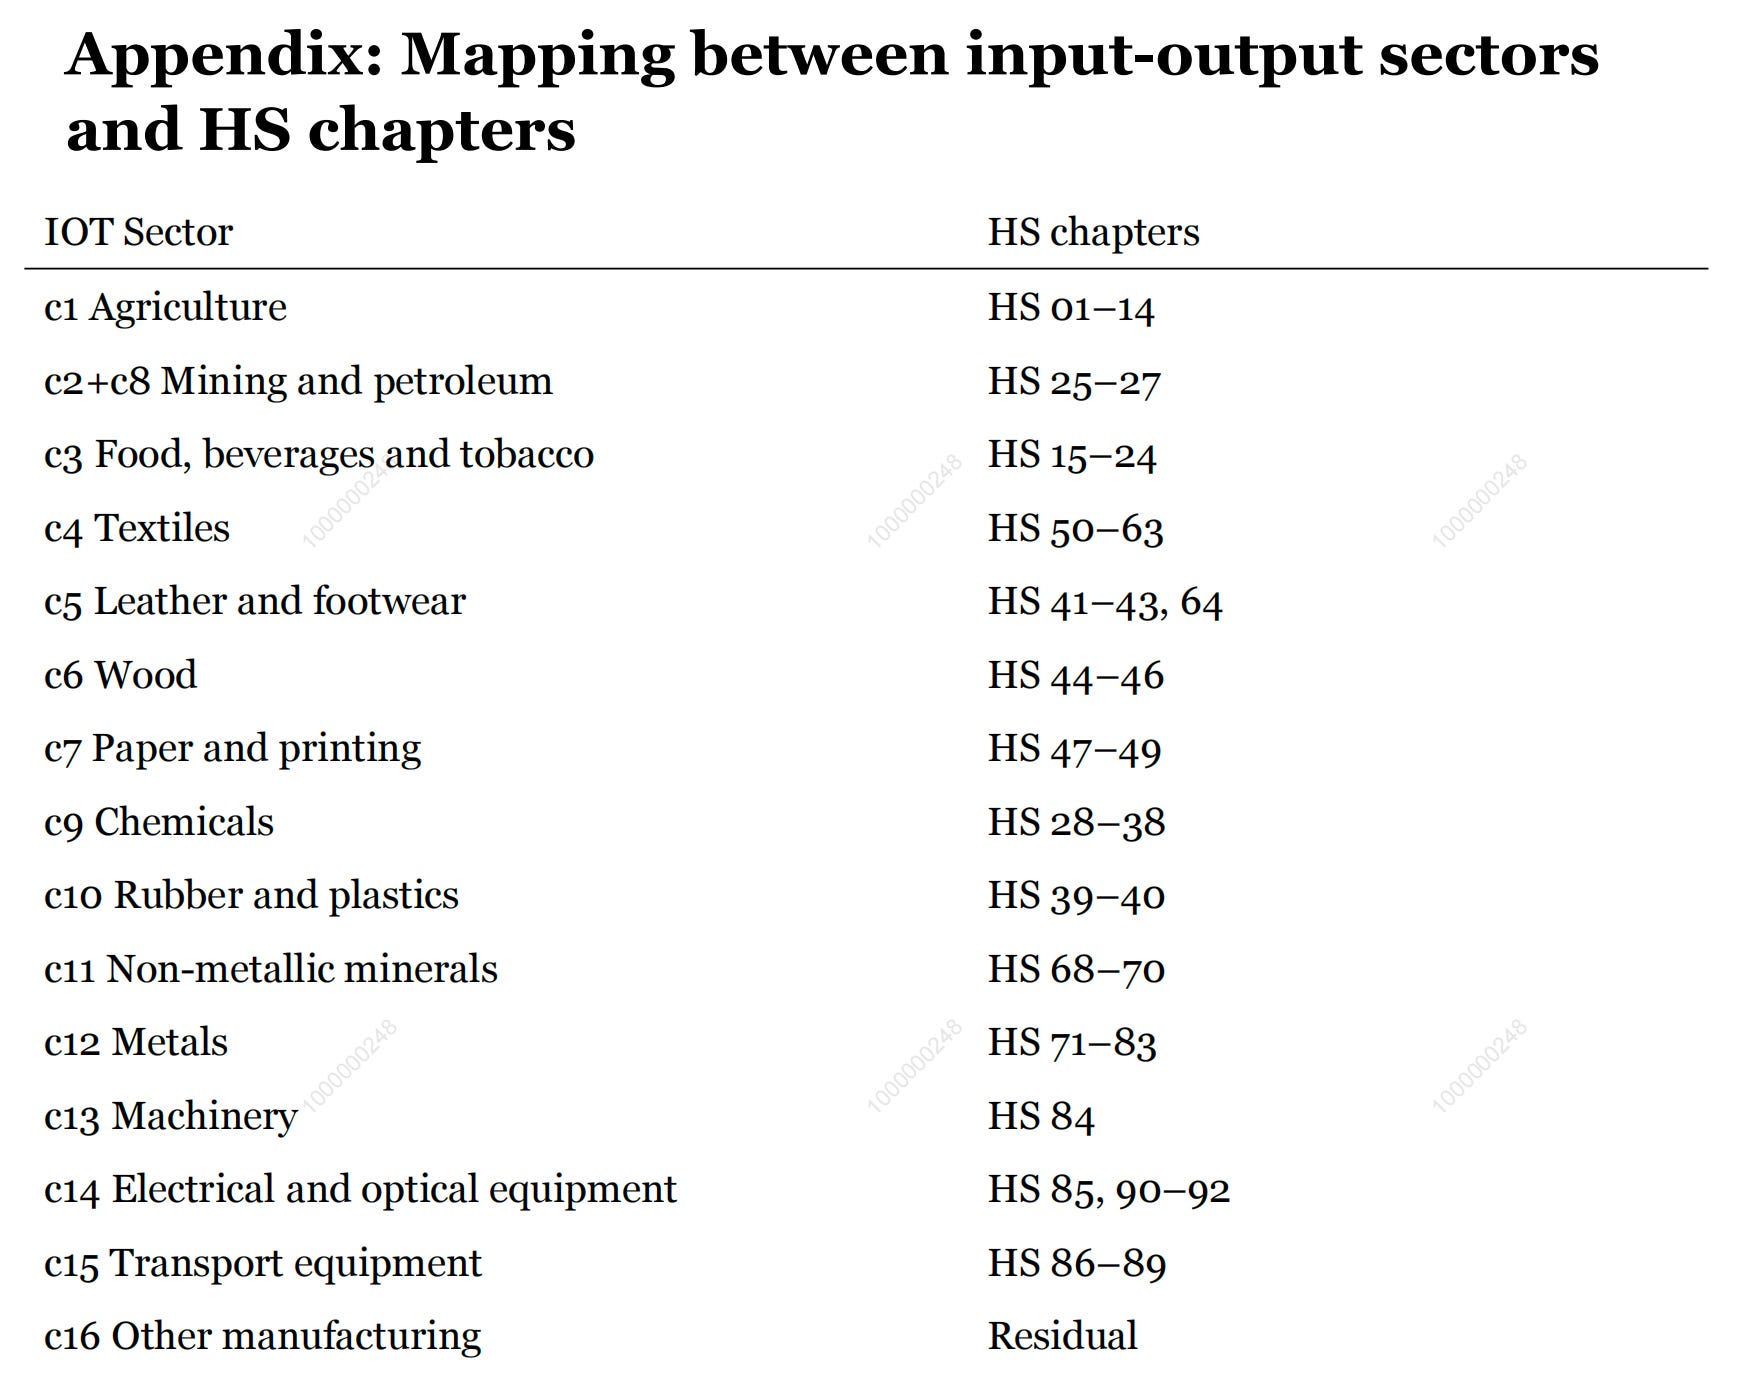
As defined here, c16 includes both “other manufacturing” in the usual sense and the portion of the trade data not disclosed in the detailed breakdown. The mapping between IOT goods sectors and HS2 chapters is shown in the Appendix.
It should be noted that apparent consumption is appropriate for within-sector analysis, but it should not be summed directly across sectors. Upstream products can reappear as intermediate inputs in downstream sectors, which would create double counting in cross-sector aggregates. For this reason, the aggregate results in this article are not obtained by simply adding up sectoral apparent consumption. Instead, the sectoral decomposition results are aggregated using weights based on the structure of EU exports to China. In this way, double counting in apparent consumption does not affect the identification of the sources of change in EU exports.
At the aggregation stage, this article uses Törnqvist weights, defined as the arithmetic average of each sector’s share in total EU exports to China in the base year and the end year. This reflects the importance of each sector in the EU export basket while reducing the influence of any single year’s weights. Because logarithmic decomposition involves an inherent aggregation error, the weighted sum of sectoral log changes does not exactly match the log change calculated directly from the aggregate total. In this article, the gap is 0.16 percentage points, which does not affect the identification of the dominant factor. The reason for using the structure of EU exports to China as weights is that the question under study is why EU exports to China declined. The aggregate decomposition should therefore reflect the structure of the EU export basket, not the structure of China’s imports or China’s domestic demand. The weighted “change in China’s domestic demand” should be understood as the average change in China’s domestic demand faced by the sectors where EU exports are concentrated, rather than as a change in China’s economy-wide domestic demand.
3.2 Sectoral results
Table 1 reports the sectoral results of the four-factor decomposition and the weighted aggregate. Structurally, the four largest sectors in EU exports to China—machinery, electronics and optical products, transport equipment, and chemicals—together account for more than 70% of the total. Of these, only electronics and optical products saw a slight decline in domestic demand. In the other three sectors, China’s domestic demand expanded between 2021 and 2024. In other words, weaker EU exports were not caused by a general contraction in the sectors where EU exports are concentrated. What changed instead was the divergence in import penetration and EU share across sectors. The most illustrative sector groups are discussed below.
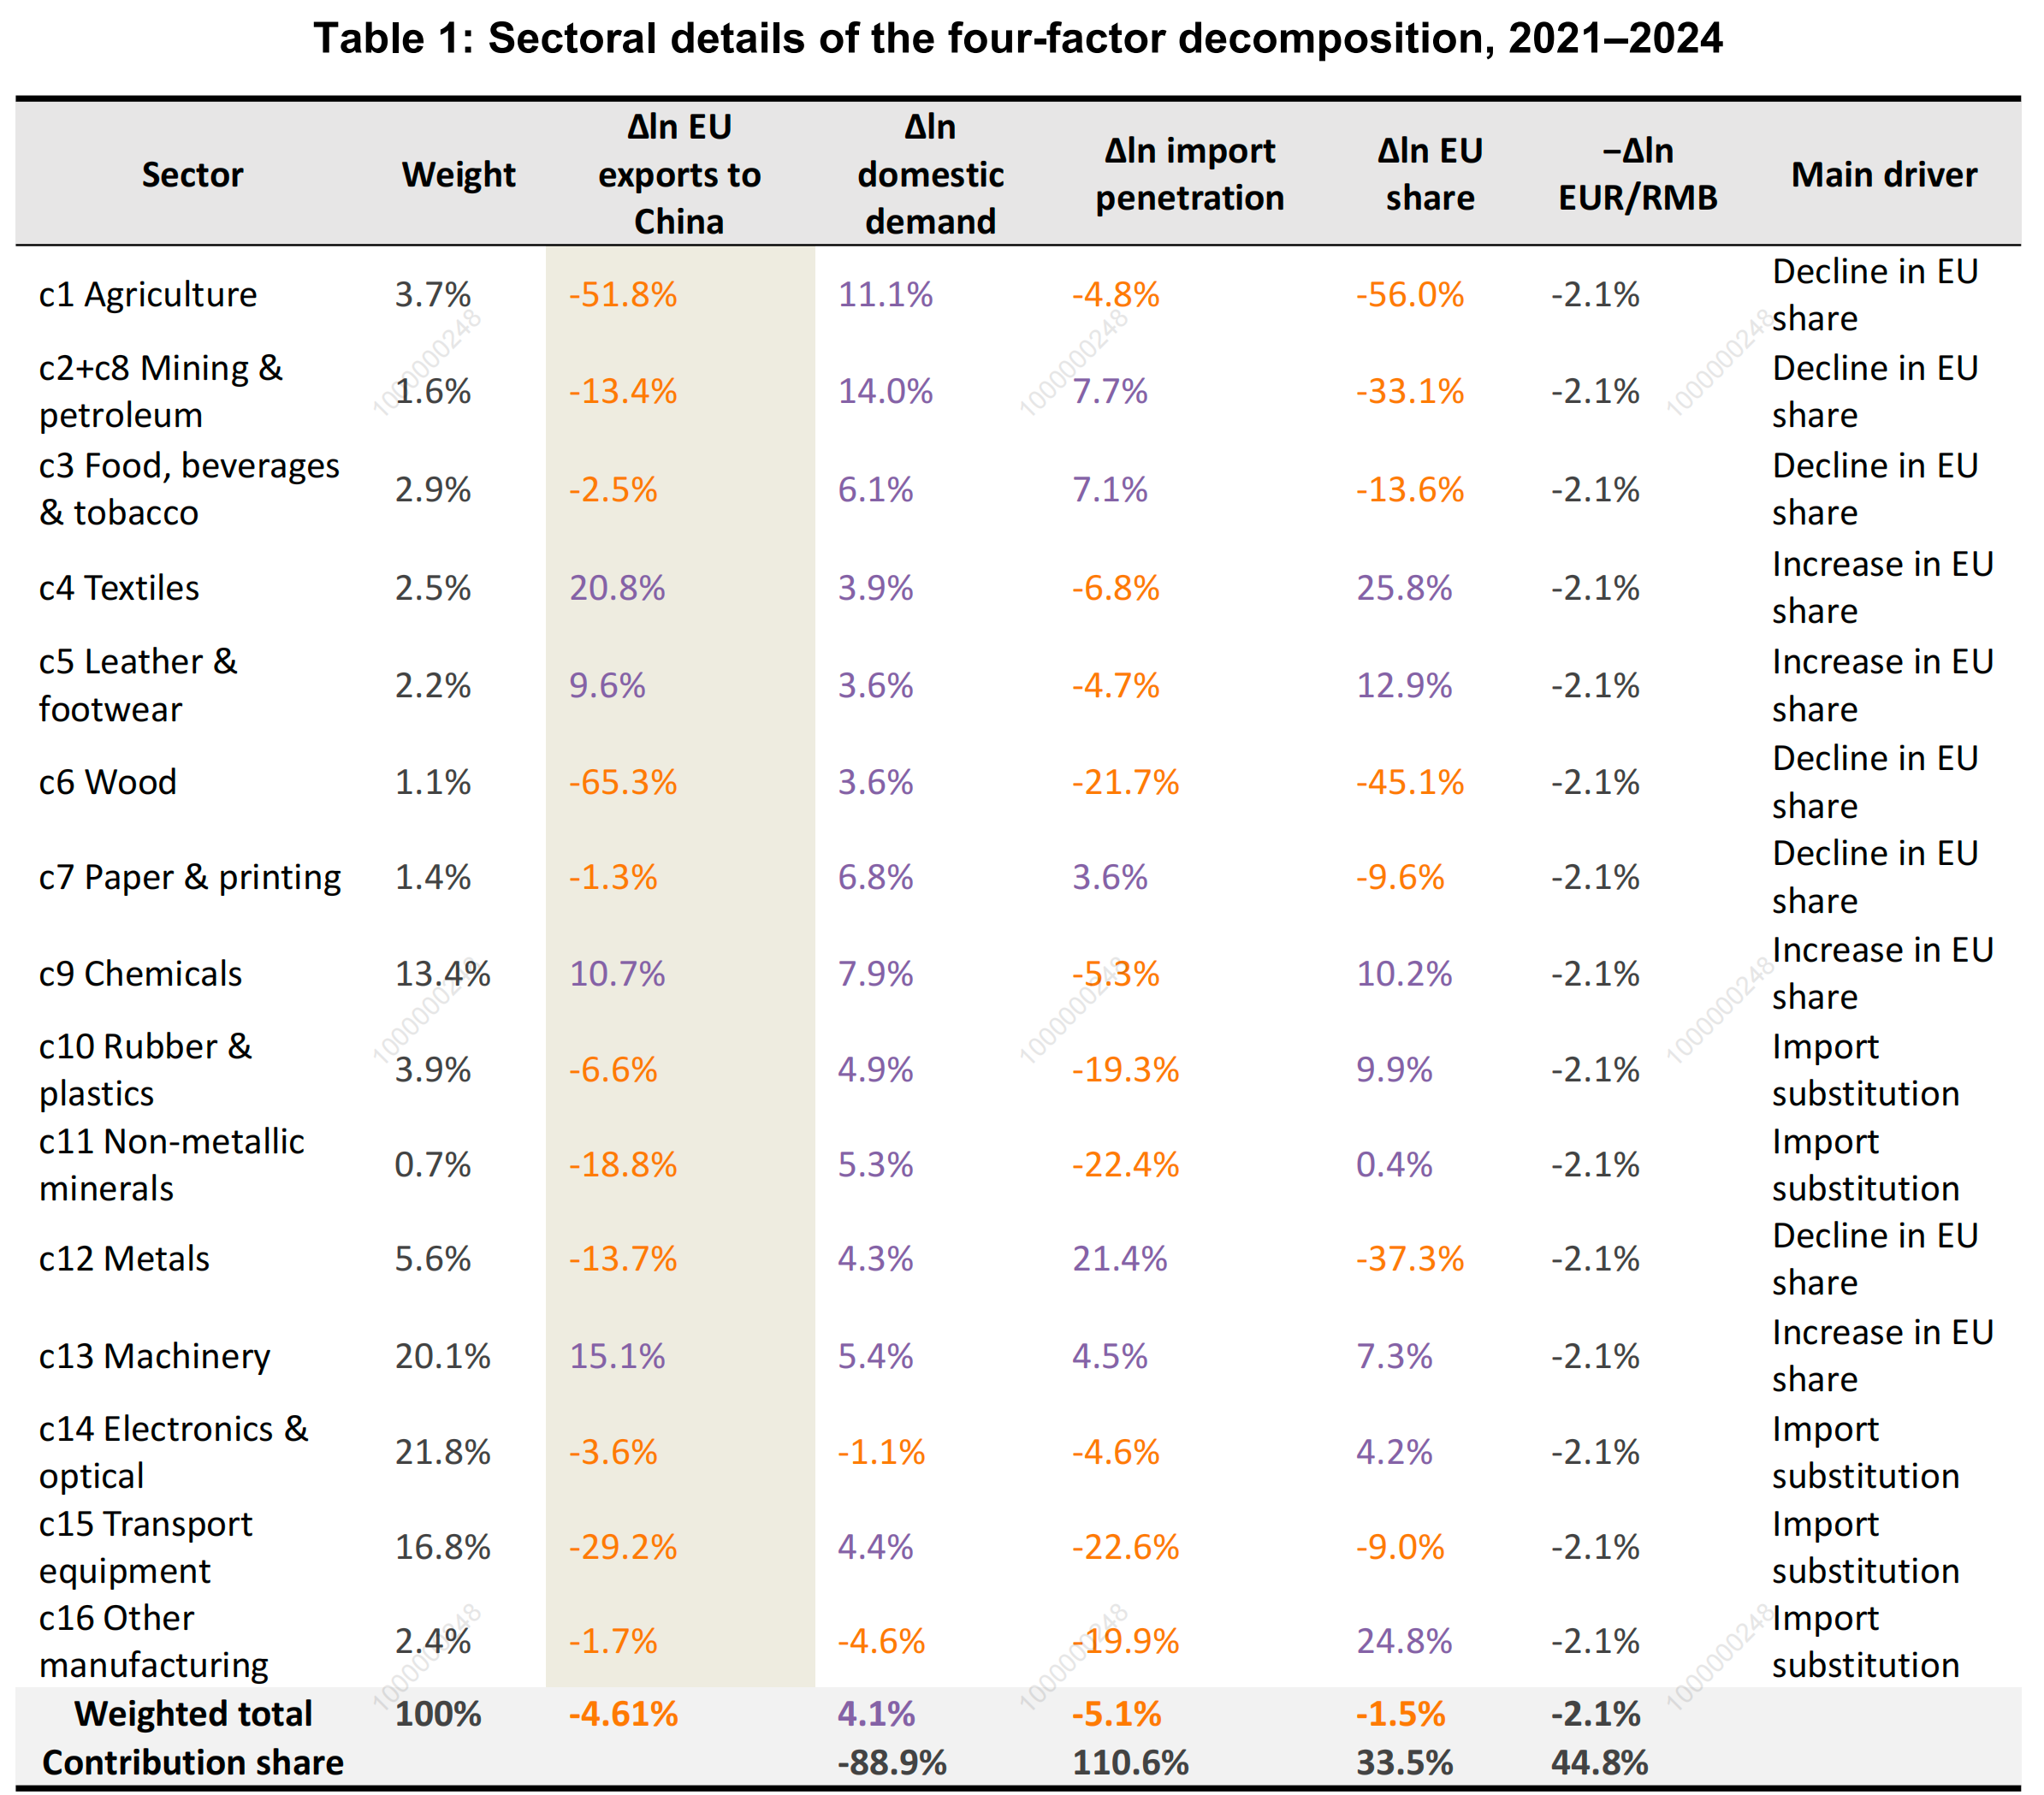
Transport equipment (weight: 16.8%) was the largest negative contributor in absolute terms. EU exports to China fell from EUR 42.2 billion in 2021 to EUR 31.5 billion in 2024, a decline of EUR 10.7 billion—the largest absolute drop of any sector. The total log change in exports was −29.2%, of which the −22.6% change in import penetration was the dominant component, marking a far steeper fall than in other categories. This shows that import substitution in China’s automotive sector and related supply chains was the main reason for the decline in EU exports. EU share also fell by 9.0%, which means that even in the part of transport equipment that China still relied on imports, the EU’s relative position weakened. By contrast, China’s domestic demand in RMB still increased by 4.4%, which means that the Chinese market itself did not shrink. What changed was that a larger share of demand was met by domestic producers. Transport equipment provides the clearest illustration of the article’s main argument: EU exports to China fell not because China’s demand contracted, but because China’s industrial upgrading and import substitution eroded the EU’s previous position.
Electronics and optical products (weight: 21.8%) carry the largest weight in the export basket. EU exports to China fell from EUR 48.4 billion in 2021 to EUR 46.7 billion in 2024, a decline of EUR 1.7 billion. The total log change in exports was only −3.6%, but because of the sector’s size, it still had a significant drag on the aggregate value. The decomposition shows that the main driver was the decline in import penetration of 4.6%, suggesting that China’s domestic supply capacity in areas such as semiconductors and optical instruments was improving and that dependence on imports was easing. At the same time, domestic demand also fell slightly, by 1.1%, indicating some weakness on the demand side. However, EU share increased by 4.2%, which suggests that even in a context of slowing demand and rising import substitution, the EU remained competitive in some higher-end segments. The decline in this sector, therefore, does not mean that EU products “lost the market”. It looks more like a case where the overall scope for imports narrowed in a market with slower growth and faster substitution.
Machinery (weight: 20.1%) was the strongest-performing sector. EU exports to China rose from EUR 40.4 billion in 2021 to EUR 47.0 billion in 2024, an increase of EUR 6.6 billion—the largest positive contribution and the biggest increase in absolute value. The total log change in exports was +15.1%. Domestic demand rose by 5.4%, EU share increased by 7.3%, and import penetration also increased slightly, by 4.5%. All three components were positive. In a context where import dependence declined in most sectors, machinery was an exception. The rise in import penetration suggests that China’s demand for imported machinery, especially higher-end equipment, was still increasing. The increase in the EU share further indicates that European firms were not being displaced in this sector. On the contrary, they continued to benefit from China’s industrial upgrading and investment demand for equipment. Machinery shows that the recent weakness in EU exports to China was not a broad-based loss of competitiveness. In selected areas such as higher-end equipment, the EU still held a clear advantage.
Chemicals (weight: 13.4%) present a more complex picture and illustrate sectoral differentiation particularly well. EU exports to China increased from EUR 27.7 billion in 2021 to EUR 30.8 billion in 2024, a rise of EUR 3.1 billion. The total log change in exports was +10.7%. Domestic demand rose by 7.9%, and EU share rose by 10.2%, showing that demand in the Chinese market continued to increase and that the EU’s competitive position improved at the same time.
However, import penetration fell by 5.3%, indicating that domestic supply capacity in China’s chemicals sector was also strengthening and that import dependence did not rise. EU exports still increased because the gain in EU share was larger than the fall in import dependence. In other words, although China’s chemical industry was also undergoing import substitution, the EU continued to hold an advantage in higher value-added and more technology-intensive segments. The case of chemicals shows that stronger manufacturing capacity in China does not necessarily imply a broad-based decline in EU exports. The key is whether the EU still occupies higher-end positions within each sector.
The smaller sectors show more varied patterns, but they do not alter the main conclusion. In agriculture, mining and petrochemicals, food, beverages and tobacco, paper and printing, and metals, the main drag came from a decline in EU share. This suggests that China still had import demand in these sectors, but the EU’s relative position in China’s imports weakened. In non-metallic minerals, rubber and plastics, and other manufacturing, the main constraint came from lower import penetration, indicating that import substitution was also advancing in a wider range of manufacturing sectors. At the same time, a small number of light-industry sectors, such as textiles and leather and footwear, still recorded export growth, mainly because EU share increased. This suggests to some extent that the Chinese market continued to show solid demand for higher-end European consumer products such as branded clothing and leather goods. Overall, however, these sectors carry relatively small weights. Their patterns differ, but their influence on the aggregate result is limited. The broad structure is still dominated by transport equipment, electronics and optical products, machinery, and chemicals.
3.3 Weighted aggregate: domestic demand was still expanding, while import substitution was the main driver
Once the four factors are aggregated using sectoral weights, the results show that between 2021 and 2024, the weighted average of Chinese apparent consumption in the sectors where EU exports are concentrated increased by 4.1%. This means that the total amount absorbed by the Chinese market in these sectors did not contract. What actually narrowed the room for EU exports was the 5.1% decline in import penetration. In other words, a rising share of demand was met by domestic Chinese producers.
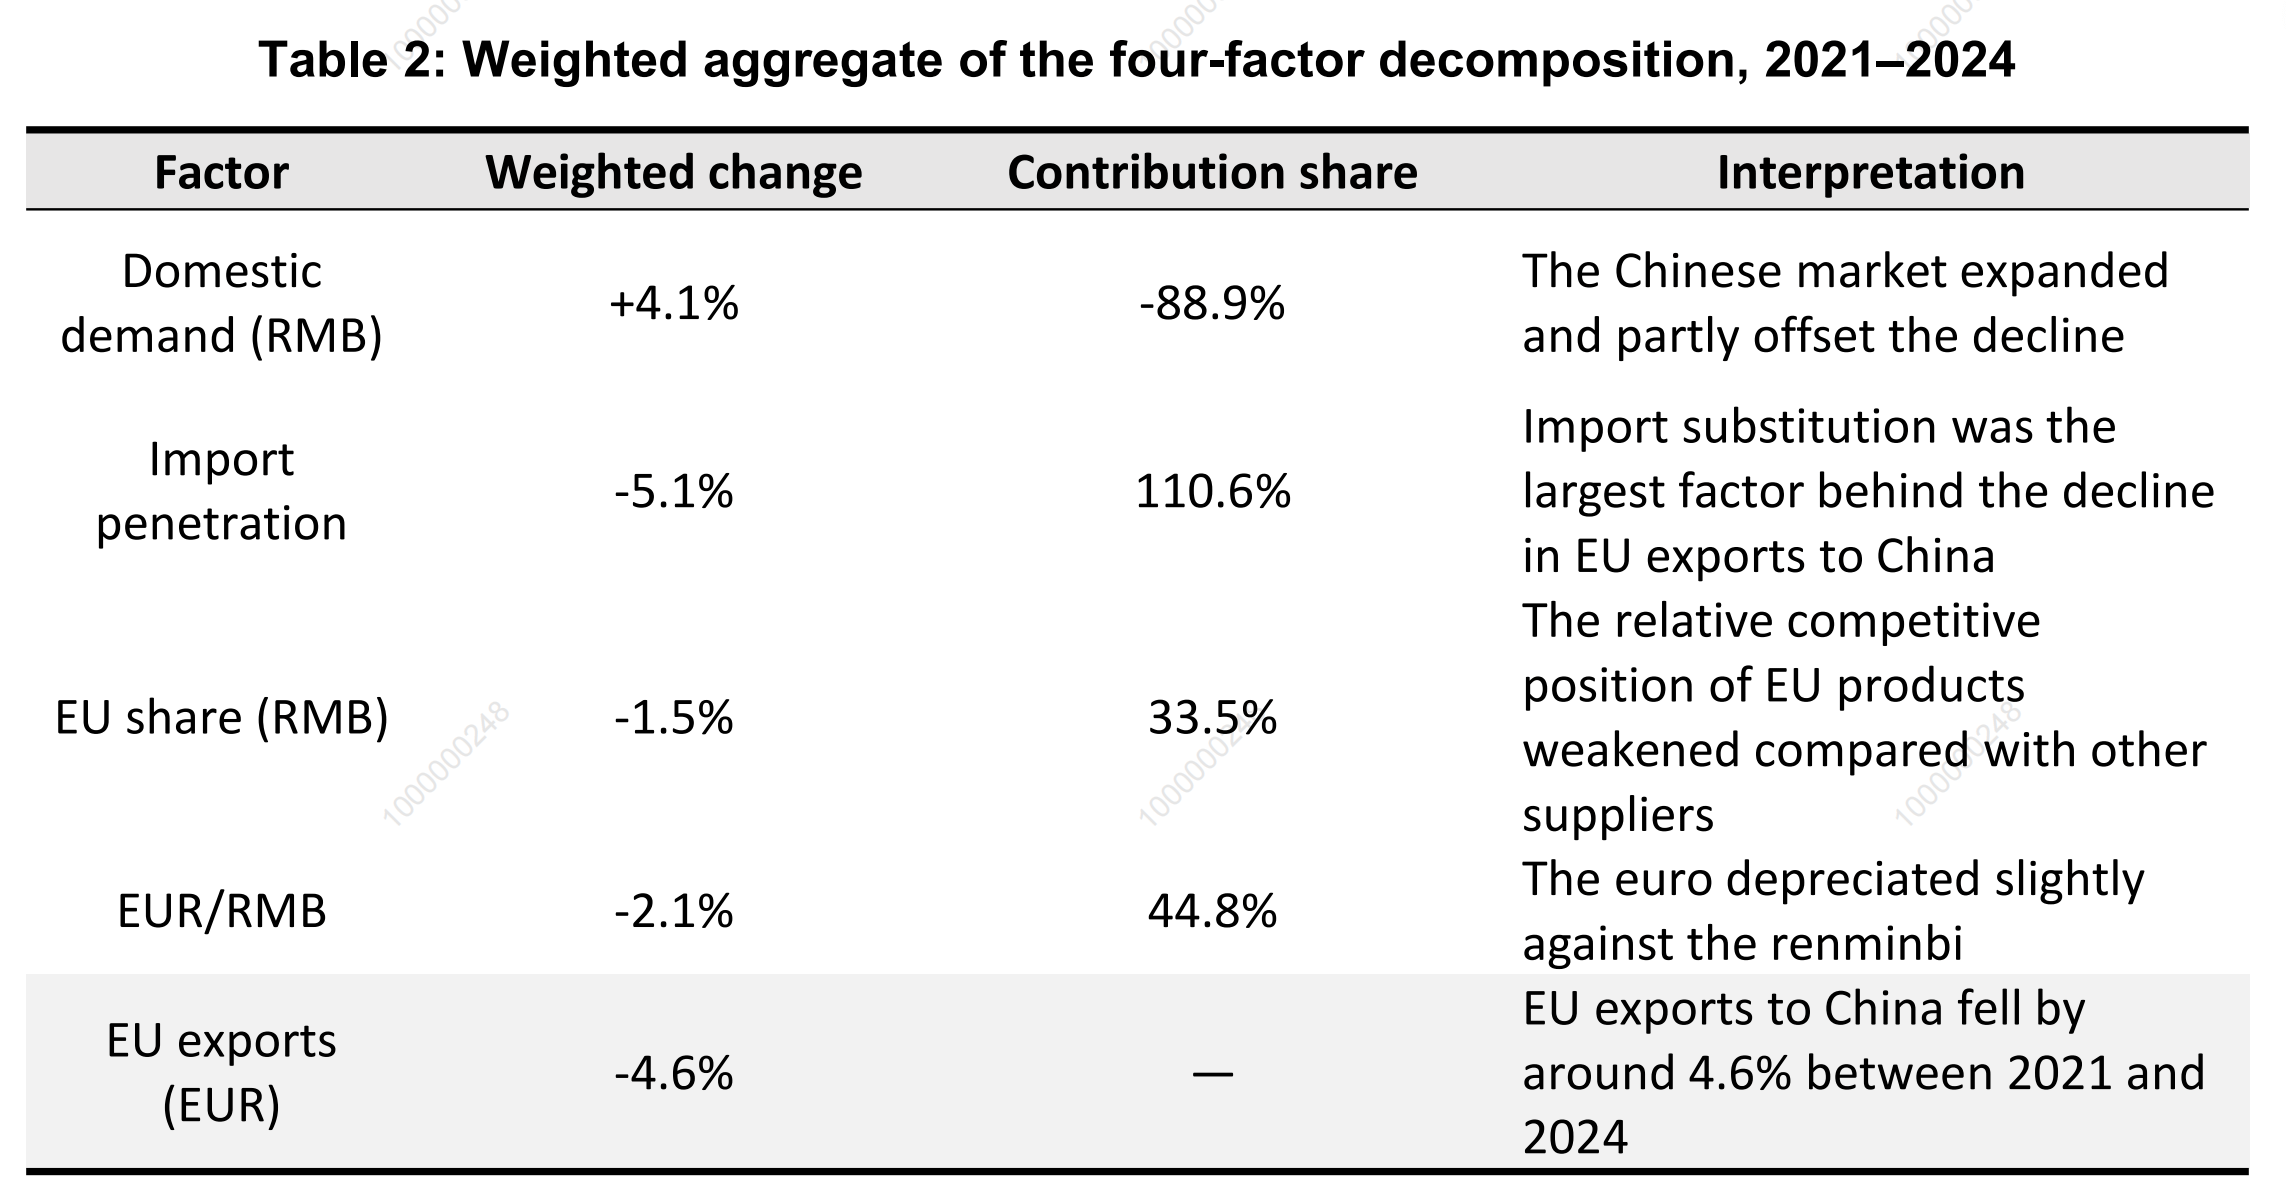
Between 2021 and 2024, the weighted average of Chinese domestic demand in the sectors where EU exports are concentrated increased by 4.1%. This shows that the Chinese market targeted by major EU exports did not contract. The weakness in EU exports to China cannot therefore be explained simply by lower domestic demand.
The 5.1% fall in import penetration was the dominant factor behind the decline in EU exports. Although domestic demand in the relevant Chinese sectors was still increasing, import penetration was falling even faster. That is, a larger share of domestic demand was being met by domestic production, and the expansion of domestic demand was not enough to offset this shift. EU exports, therefore, still declined.
The 1.5% fall in EU share suggests that the relative competitive position of EU products also weakened within China’s total imports. The exchange rate term, at −2.1%, is only a valuation effect and was not the main driver.
Overall, the main reason EU exports to China fell between 2021 and 2024 was a systematic decline in China’s dependence on imports from the EU, rather than a general contraction in the Chinese market. For the EU, this means the issue is not merely cyclical. China is advancing import substitution more quickly in several key industries.
IV. Germany: A Microcosm of the Two Channels of Impact
Germany is both a microcosm of the widening EU trade imbalance with China and the clearest case of the dual impact of Europe’s energy constraints and China’s industrial upgrading. In 2025, Germany’s exports to China fell by about EUR 8 billion year on year, accounting for roughly 60% of the EU’s net decline in exports to China of about EUR 14 billion (Figure 12). Over a longer period, the change in Germany’s trade with China was not a short-term anomaly. Between 2015 and 2021, Germany generally maintained a sizeable trade surplus with China, supported mainly by manufacturing exports such as machinery and transport equipment. Since 2021, that advantage has weakened markedly, and by 2025, Germany had moved into a trade deficit with China (Figure 13).
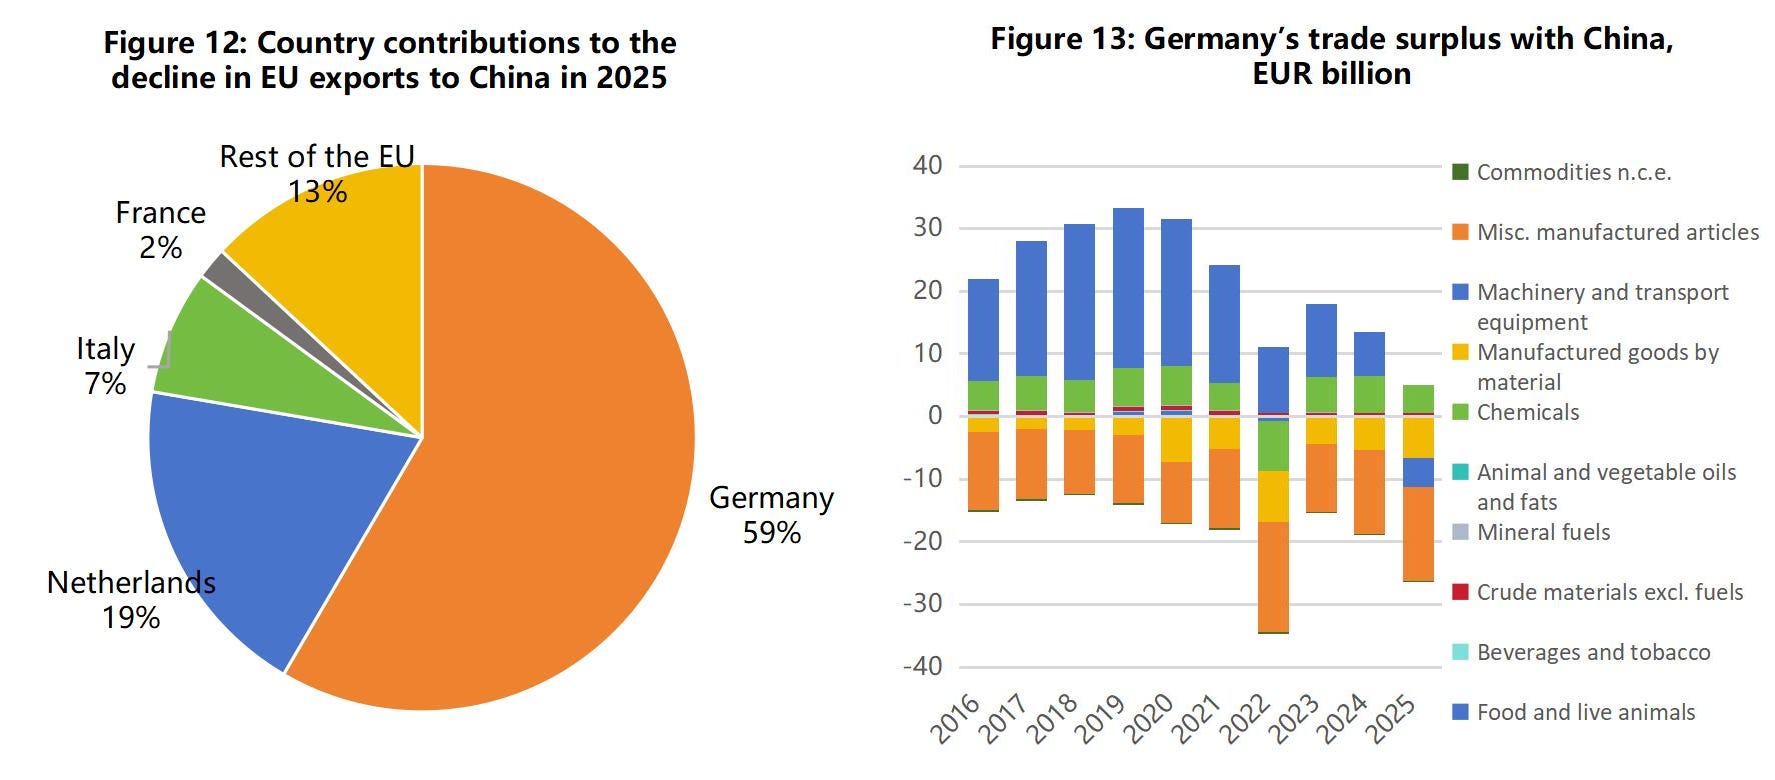
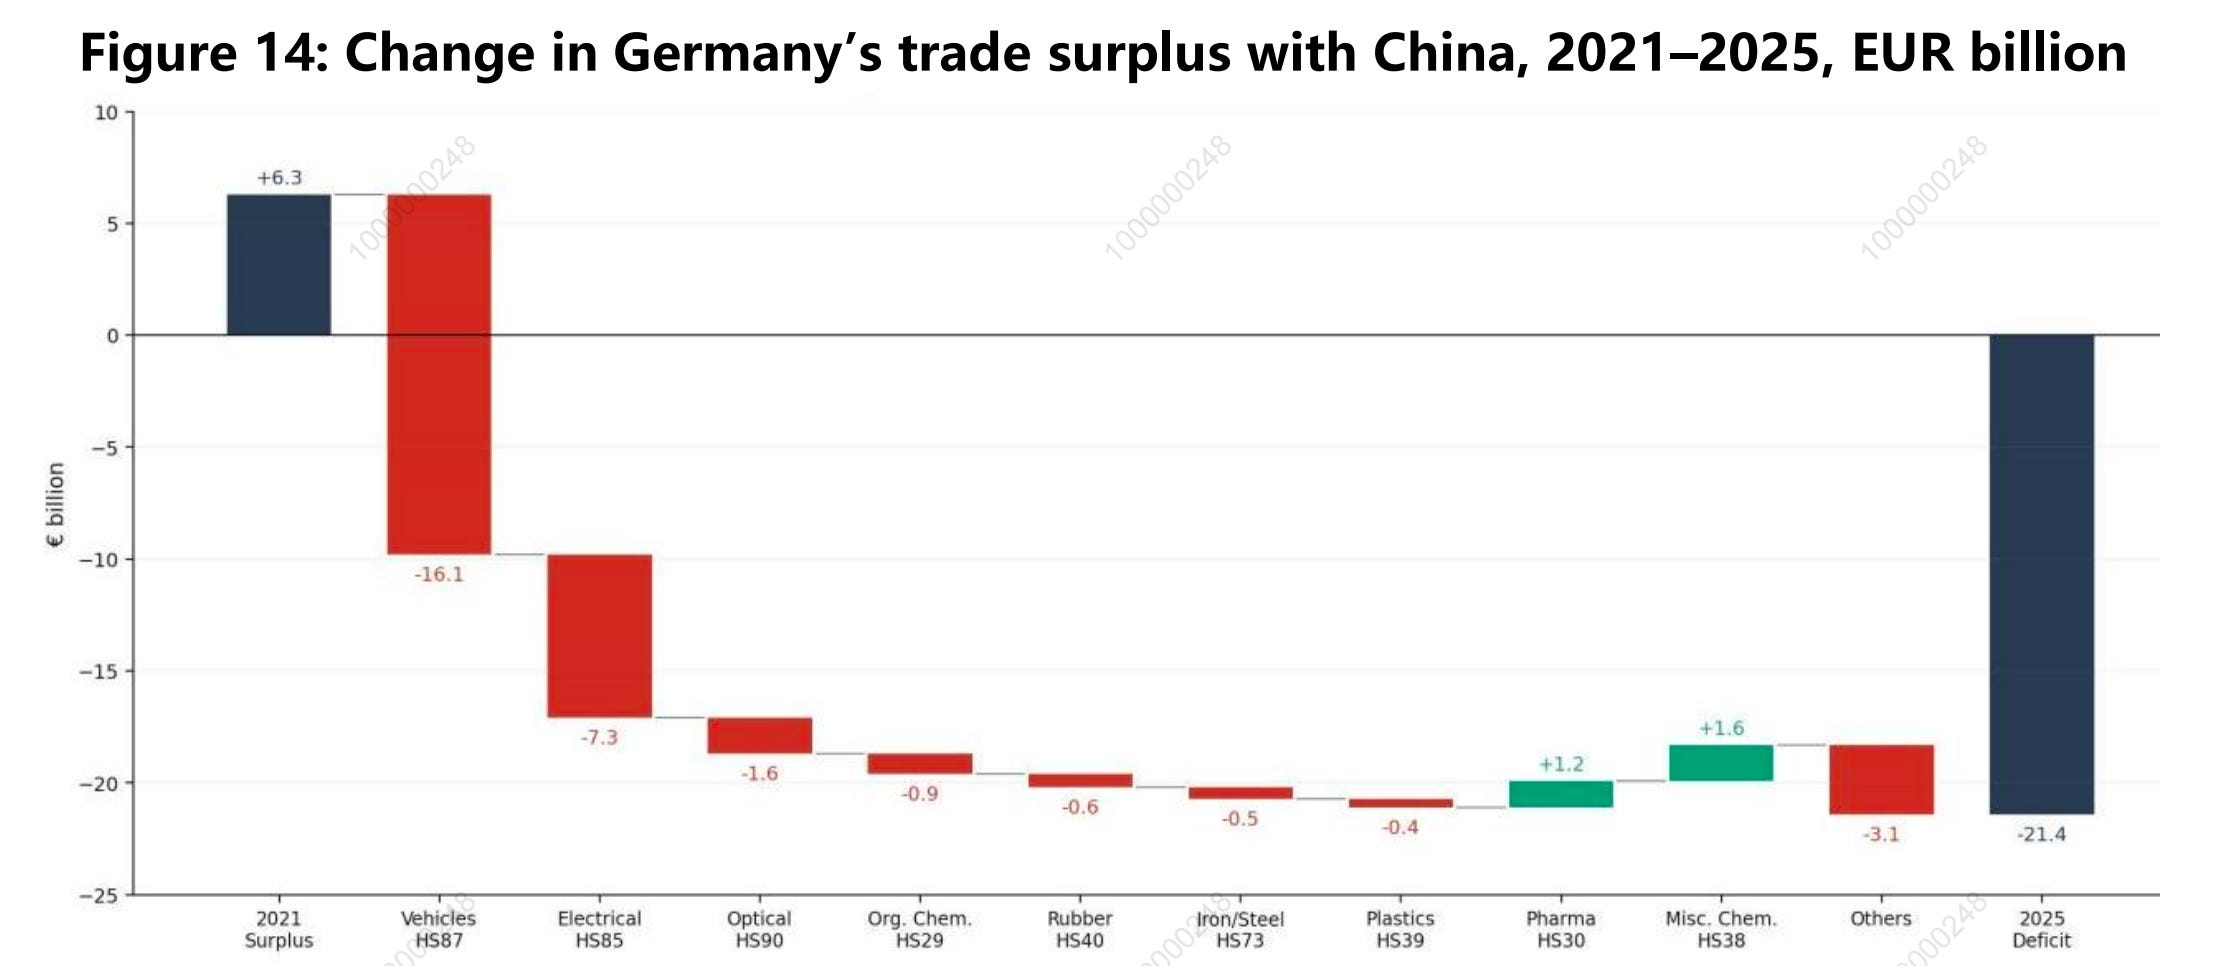
Figure 14 decomposes the change in Germany’s trade balance with China between 2021 and 2025 by HS2 category. Germany recorded a trade surplus of EUR 6.3 billion with China in 2021. By 2025, this had turned into a deficit of EUR 21.4 billion, implying a deterioration of about EUR 27.7 billion in total.
Vehicles (HS87) accounted for EUR 16.1 billion of this deterioration, while electrical equipment (HS85) accounted for EUR 7.3 billion. Together, the two categories explained 84% of the total decline.4 Only pharmaceuticals and miscellaneous chemical products showed improvement, and their gains were far too small to offset the drag from the main categories.
The transmission mechanisms in these two categories were fundamentally different. They map onto the two channels discussed earlier: one operating through Germany’s exports to China, the other through Germany’s imports from China.
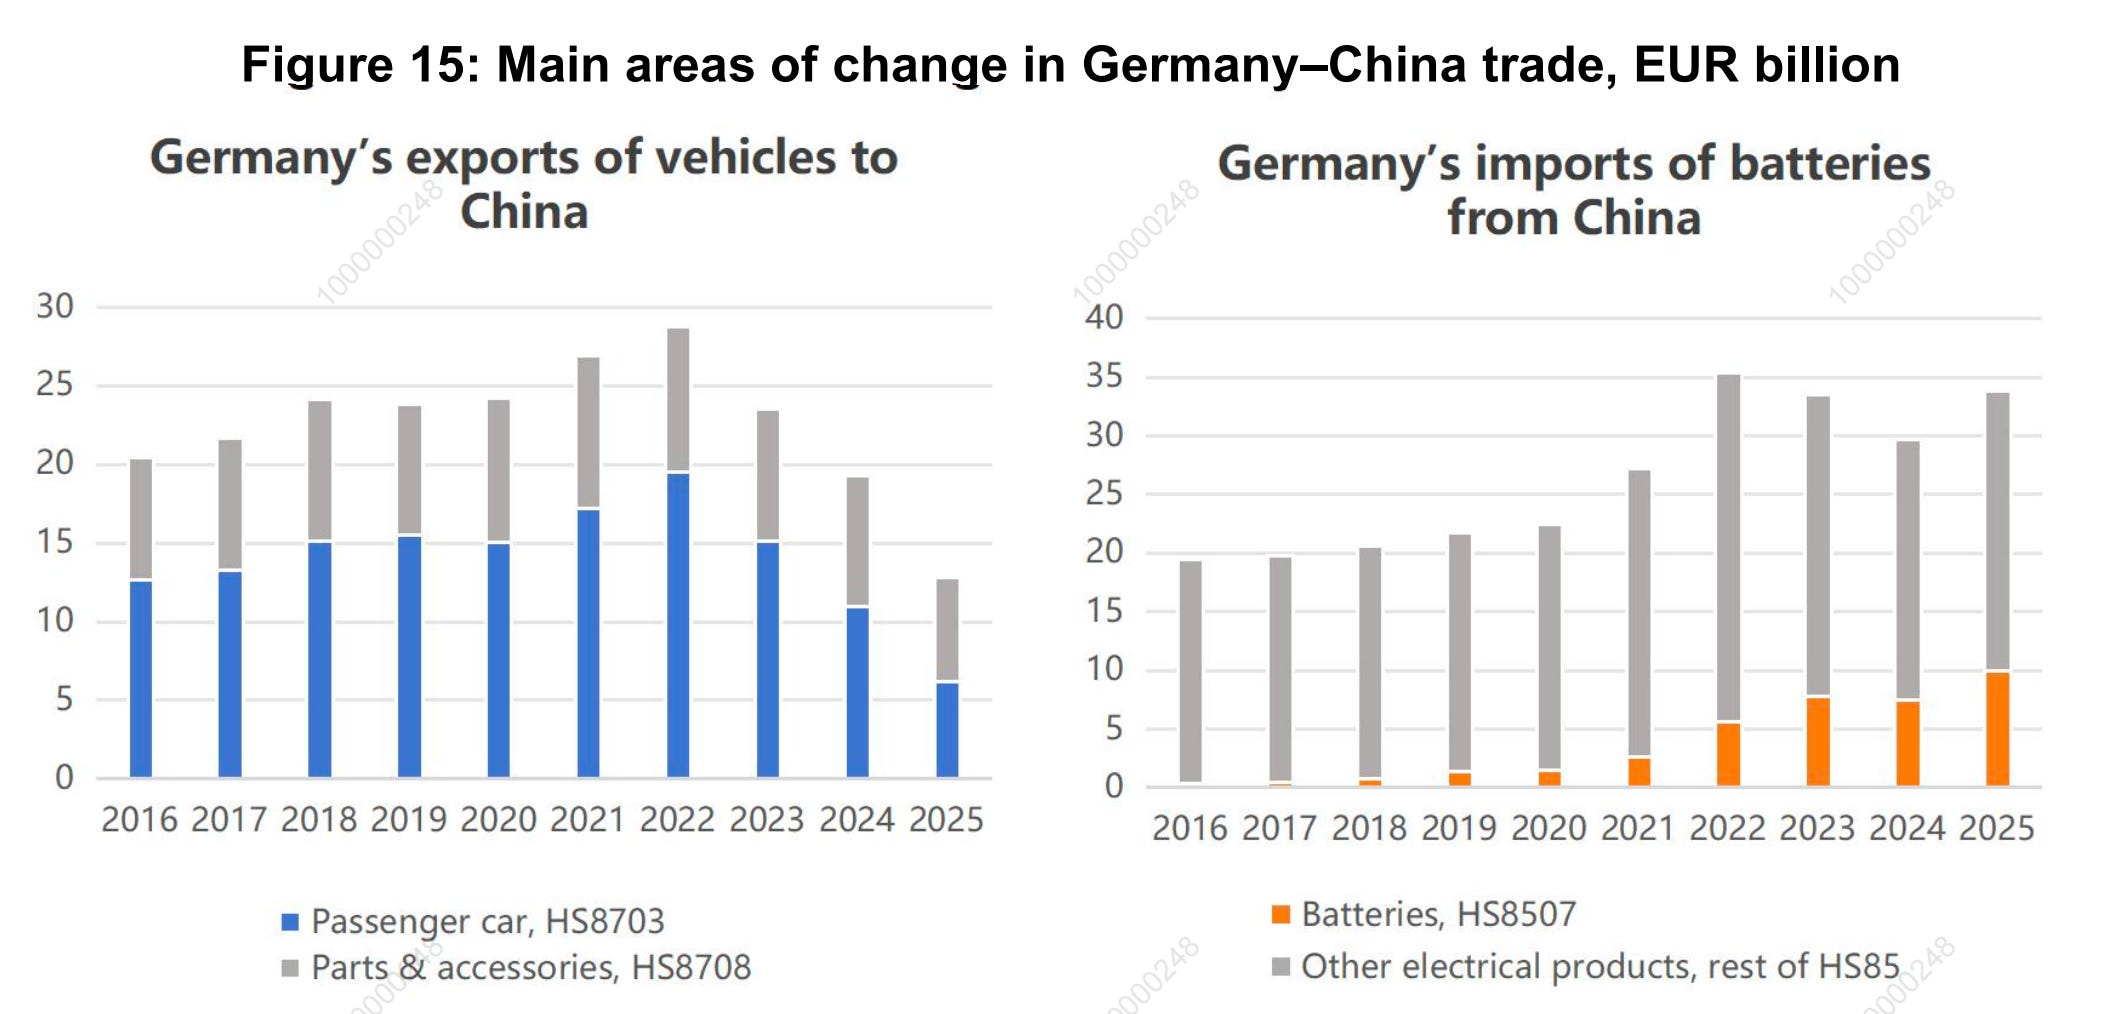
Vehicles: a sharp contraction in Germany’s exports to China. The left panel of Figure 15 breaks Germany’s vehicle trade with China into passenger cars (HS8703) and parts and accessories (HS8708). Passenger car exports alone fell sharply from EUR 17.2 billion in 2021 to EUR 6.2 billion in 2025, a decline of EUR 11 billion. Exports of parts and accessories fell from EUR 9.7 billion to EUR 6.7 billion, a decline of EUR 3 billion. By contrast, Germany’s imports of vehicles from China increased only modestly, from EUR 3.3 billion to EUR 5 billion, an increase of just EUR 1.7 billion. Of the EUR 16.1 billion deterioration in the vehicle trade balance, around 90% came from lower German exports and only around 10% from higher imports.
The core driver was a shift in demand within the Chinese market toward domestic brands. Since 2021, the penetration of new energy vehicles in China has risen rapidly. Domestic brands have replaced imports in the lower and middle segments and have also put significant competitive pressure on German brands in the upper-middle and higher-end segments. Demand for imported combustion cars declined steadily, directly narrowing room for German exports of vehicles and components. This is the sectoral manifestation of the import substitution process discussed in Section III. The Chinese car market did not shrink, but a larger share of new demand was met by domestic producers.
Electrical equipment: a strong rise in Germany’s imports from China. The right panel of Figure 15 presents the other channel. Germany’s imports from China in this category rose from EUR 27.2 billion to EUR 33.8 billion, an increase of EUR 6.6 billion. A more detailed breakdown shows that almost all of this increase came from one sub-category alone: batteries (HS8507). Imports of batteries rose from EUR 2.6 billion in 2021 to EUR 10 billion in 2025, an increase of EUR 7.3 billion. It exceeded the increase for HS85 as a whole. This means that imports of other HS85 subcategories, such as mobile phones, computers, and other traditional consumer electronics, actually declined and were masked by the explosive growth in battery imports.
The widening deficit in electrical equipment therefore did not reflect a broad-based increase in imports of electrical products. It was highly concentrated in batteries. This corresponds to the rapid expansion of China’s new energy supply chain, especially its exports of energy-storage batteries. As Europe’s largest market for electric vehicles and industrial energy storage, Germany became a major destination for Chinese battery exports. This is a concrete example of the energy-transition demand discussed in Section II. Germany’s energy transition and rising investment in energy storage created strong battery demand, and China, with its mature and large-scale battery supply chain, became the primary external supplier.
Comparing the two channels makes the contrast clear. Both widened the trade deficit, but through very different mechanisms. In vehicles, the impact came mainly through Germany’s exports to China: the Chinese market became much less dependent on imported German vehicles, and demand shifted to domestic brands. In electrical equipment, the impact came through Germany’s imports from China: Chinese battery capacity met demand created by Germany’s energy transition. The first reflects China’s earlier import demand being replaced by Chinese domestic production. The second reflects Chinese supply matching the EU’s demand. Different as they look, both point to the same conclusion: What lies behind the widening deficit is China’s industrial upgrading in new energy industries and structural change in EU demand, not simply subsidies or the exchange rate.
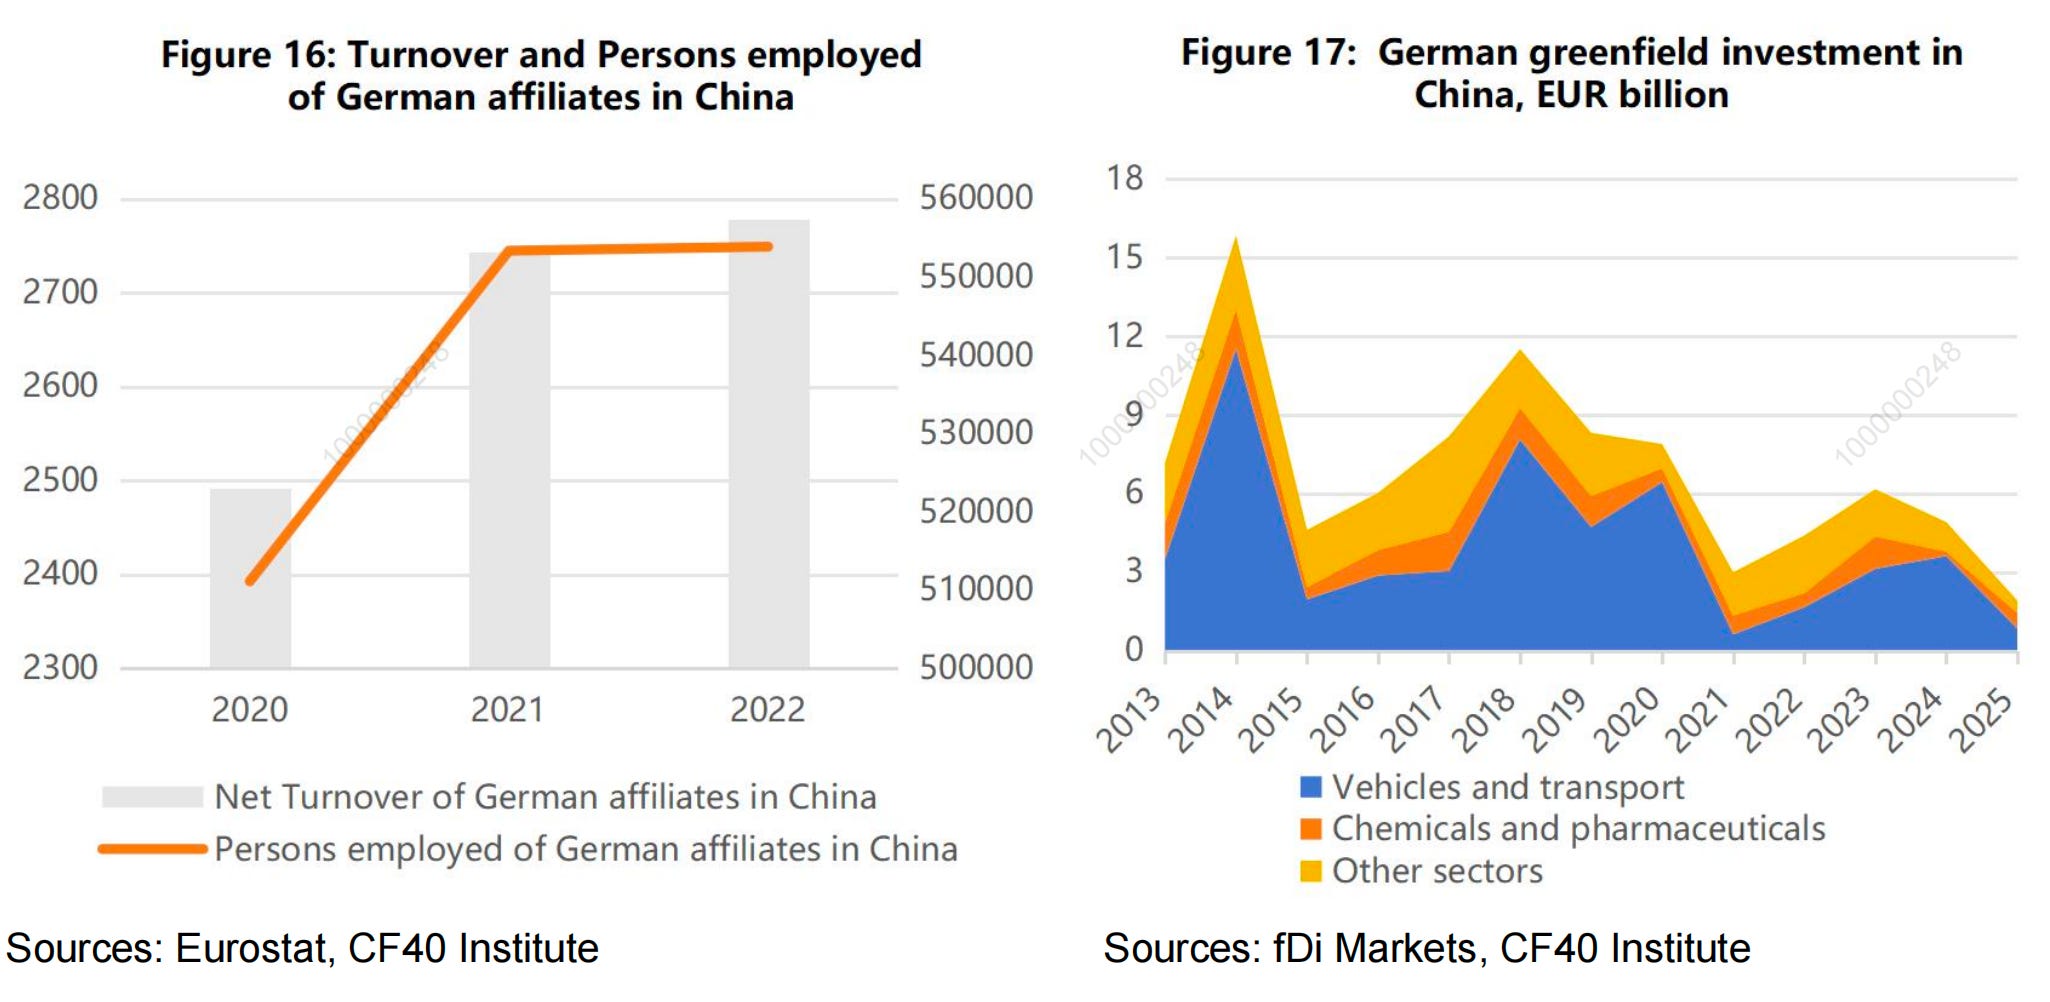
However, the sharp decline in Germany’s vehicle exports to China does not necessarily mean that German firms have “lost the Chinese market”. A further explanation is that part of the decline in exports may have been offset by local production by German firms in China. If German firms have shifted more production and sales to China, then lower exports do not necessarily imply a reduced presence in the Chinese market. Data on foreign affiliates statistics (FATS) show that between 2020 and 2022, the sales and employment of German subsidiaries in China remained high and continued to grow (Figure 16). This suggests that Germany’s participation in the Chinese market has not disappeared. Rather, it has shifted from a model based on cross-border exports to one based more on local production and local sales. In that case, even if the actual business scale of German firms in China has not contracted, Germany’s goods trade surplus with China would still shrink because production in China replaces imports from Germany.
fDi Markets data shows that Germany’s greenfield investment in China remained above EUR 4 billion per year (Figure 17), and data from the German Economic Institute (IW) shows that investment in China rose to more than EUR 7 billion between January and November 2025, the highest level in four years and 55.5% above the EUR 4.5 billion recorded in 20245. It is reasonable to infer that German firms are increasingly using local production in China to serve demand in China and around the world. This means that German firms have not lost the Chinese market. Rather, returns that were previously realised through exports to China are being generated through the profits and investment income of affiliates located in China.
V. Concluding Remarks
First, the widening China–EU trade imbalance does not reflect a broader macroeconomic imbalance. It reflects structural changes on both sides. In recent years, while China’s overall external surplus increased, Europe’s external surplus also rebounded towards more normal levels. This is not what one would expect in the case of a broad macroeconomic imbalance. If that were the case, Europe’s surplus should have fallen rather than recovered.
Instead, the increase in China’s surplus with Europe has had a clear structural pattern and can be traced to specific causes. The rise in China’s exports to the EU was concentrated in the new trio and in chemicals. The main reason was that the EU reduced its dependence on Russian energy and accelerated the green transition, which raised energy costs in Europe, weakened domestic supply capacity in related industries, and increased dependence on Chinese supply in these products. At the same time, weaker EU exports to China were not due to a shrinking Chinese market. They reflected continued industrial upgrading in China and accelerating import substitution, which reduced China’s structural demand for EU products.
Second, since the widening bilateral imbalance is driven by structural factors,short-termpolicytoolstargetingprices,theexchangerate,or subsidies are unlikely to change the broader pattern. The imbalance may continue to widen. Whether China’s external surplus is thought to reflect industrial policy or an undervalued exchange rate (which, in our view, it does not), China’s competitiveness and price advantages in new energy industries and chemicals will continue to strengthen regardless of EU trade policy. Nor will the EU’s actual demand for Chinese new energy products and chemicals disappear because of tariffs. Import substitution in China, including in vehicles, is also unlikely to stop. In a context where domestic supply in the EU remains insufficient, the energy transition is incomplete, and energy supply from the Middle East is increasingly fragile, the structural imbalance may widen further. Trade protectionism is unlikely to reverse the broader pattern.
Third, a narrow focus on the trade deficit understates the actual gains that the EU derives from its economic and trade relationship with China. China’s exports of new energy products have helped the EU advance the green transition and reduce transition costs. Europe’s imports of large volumes of Chinese chemical products essentially amount to imports of cheaper energy. These imports appear as a deficit in the trade account, but Europe benefits from them. At the same time, EU firms continue to record growth in sales in China, while also using supply chains and cost advantages in China to strengthen their global competitiveness. These gains do not show up in bilateral goods trade accounts, but they do appear on European companies’ balance sheets. A narrow focus on the bilateral trade balance no doubt risks missing the mutual benefits embedded in China–EU economic and trade relations.
Fourth, understanding the causes of the widening trade imbalance means that both sides need a more pragmatic response. For the EU, the real priority is not to reduce the bilateral trade deficit as such, but to strengthen energy resilience and enhance domestic supply capacity during the green transition. In highly competitive industries such as electric vehicles, the EU should welcome Chinese direct investment and face up to the reality of its own declining competitiveness. For China, industrial upgrading will continue, but further expansion of domestic demand would help ease the political pressure created by a widening trade surplus and generate more goodwill in the bilateral relationship. Structural factors cannot be resolved quickly, but misunderstandings and frictions can be eased. The key question is whether both sides can strengthen coordination and cooperation in a more pragmatic way.
Using the annual average ECB reference rate for EUR/CNY, the exchange rates for 2019–2025 were 7.7355, 7.8708, 7.6282, 7.0788, 7.6600, 7.7875 and 8.1185, respectively.
This section uses the one-digit SITC Rev.4 classification rather than HS because Eurostat’s unit value and volume indices are compiled on an SITC basis. The approximate correspondence between SITC and HS is: SITC 7 (machinery and transport equipment) ≈ HS 84–89; SITC 8 (miscellaneous manufactures) ≈ HS 61–67 and 94–96; SITC 6 (manufactures classified chiefly by material) ≈ HS 28–40 and 44–83; SITC 5 (chemicals) ≈ HS 28–38.
Under the HS classification, the “new trio” corresponds to the following codes in the Chinese Customs nomenclature: 38180019 (doped silicon wafers), 85076 (lithium-ion batteries), 854142–854143 (photovoltaic cells), 870122–870124 (electric tractors), 87022–87024 (electric buses), 87034–87038 (electric passenger cars) and 87044–87046 (electric trucks). In the table and throughout the remainder of the text, the categories for chemicals, transport equipment, and machinery and electrical equipment exclude any sub-items that overlap with the new trio, so as to avoid double-counting.
HS87 covers “vehicles other than railway rolling stock, and parts and accessories thereof”; HS85 covers “electrical machinery and equipment, and parts thereof”. In the discussion below, HS8703 refers to motor vehicles principally designed for the transport of persons, HS8708 to parts and accessories of motor vehicles, and HS8507 to batteries.


Useful framing of the EU-China trade relations. I'd suggest three takeaways:
- the EU "green transition" has a lot to answer. Both on the transition away from European competencies and industrial capacity. The EU will likely need to choose between virtue and sovereignty.
- the import substitution in China was not an accident. It was intentional China 2025 policy. This likely cannot be undone, so will probably impair any opportunity for balanced trade.
- the idea that products produced in China by EU companies are somehow more appropriate for importing into the EU is not likely to survive.
So, the real question is not who's to blame for the imbalance, it's what can the EU do to protect itself from further de-industrialization. Unfortunately, I don't think China is part of the answer.
This is well documented and insightful.